Chrome has been my default browser for many years now, but I’ve been thinking that my familiarity with just one browser has become a problem. If I tend to design for a single browser, then I’ll start to make assumptions that those features are available for everyone. Then I’m likely to miss important differences between browsers which could introduce bugs into the codebase or influence the amount of time I spend designing a feature.
I’ve started to call this problem “Chrome Bias”, and over the past week, I decided I would do something about it by switching to Firefox. This way I could figure out what’s new in one of the most popular web browsers out there. But! While I was running this little experiment of mine, I found three Firefox features that you might not know about if you suffer from extreme Chrome Bias like I do.
I think these Firefox developer tool features are pretty nifty:
Theming the Developer Tools
I didn’t know that you can set the theme of the Developer Tools in Firefox. That is particularly helpful for me when I want to work on something at night and can configure the theme to dark:

Fonts tab
Firefox’s font tab might not be new but it certainly is to me. On the far right you can select the tab and see the type info for whichever element you’ve selected:
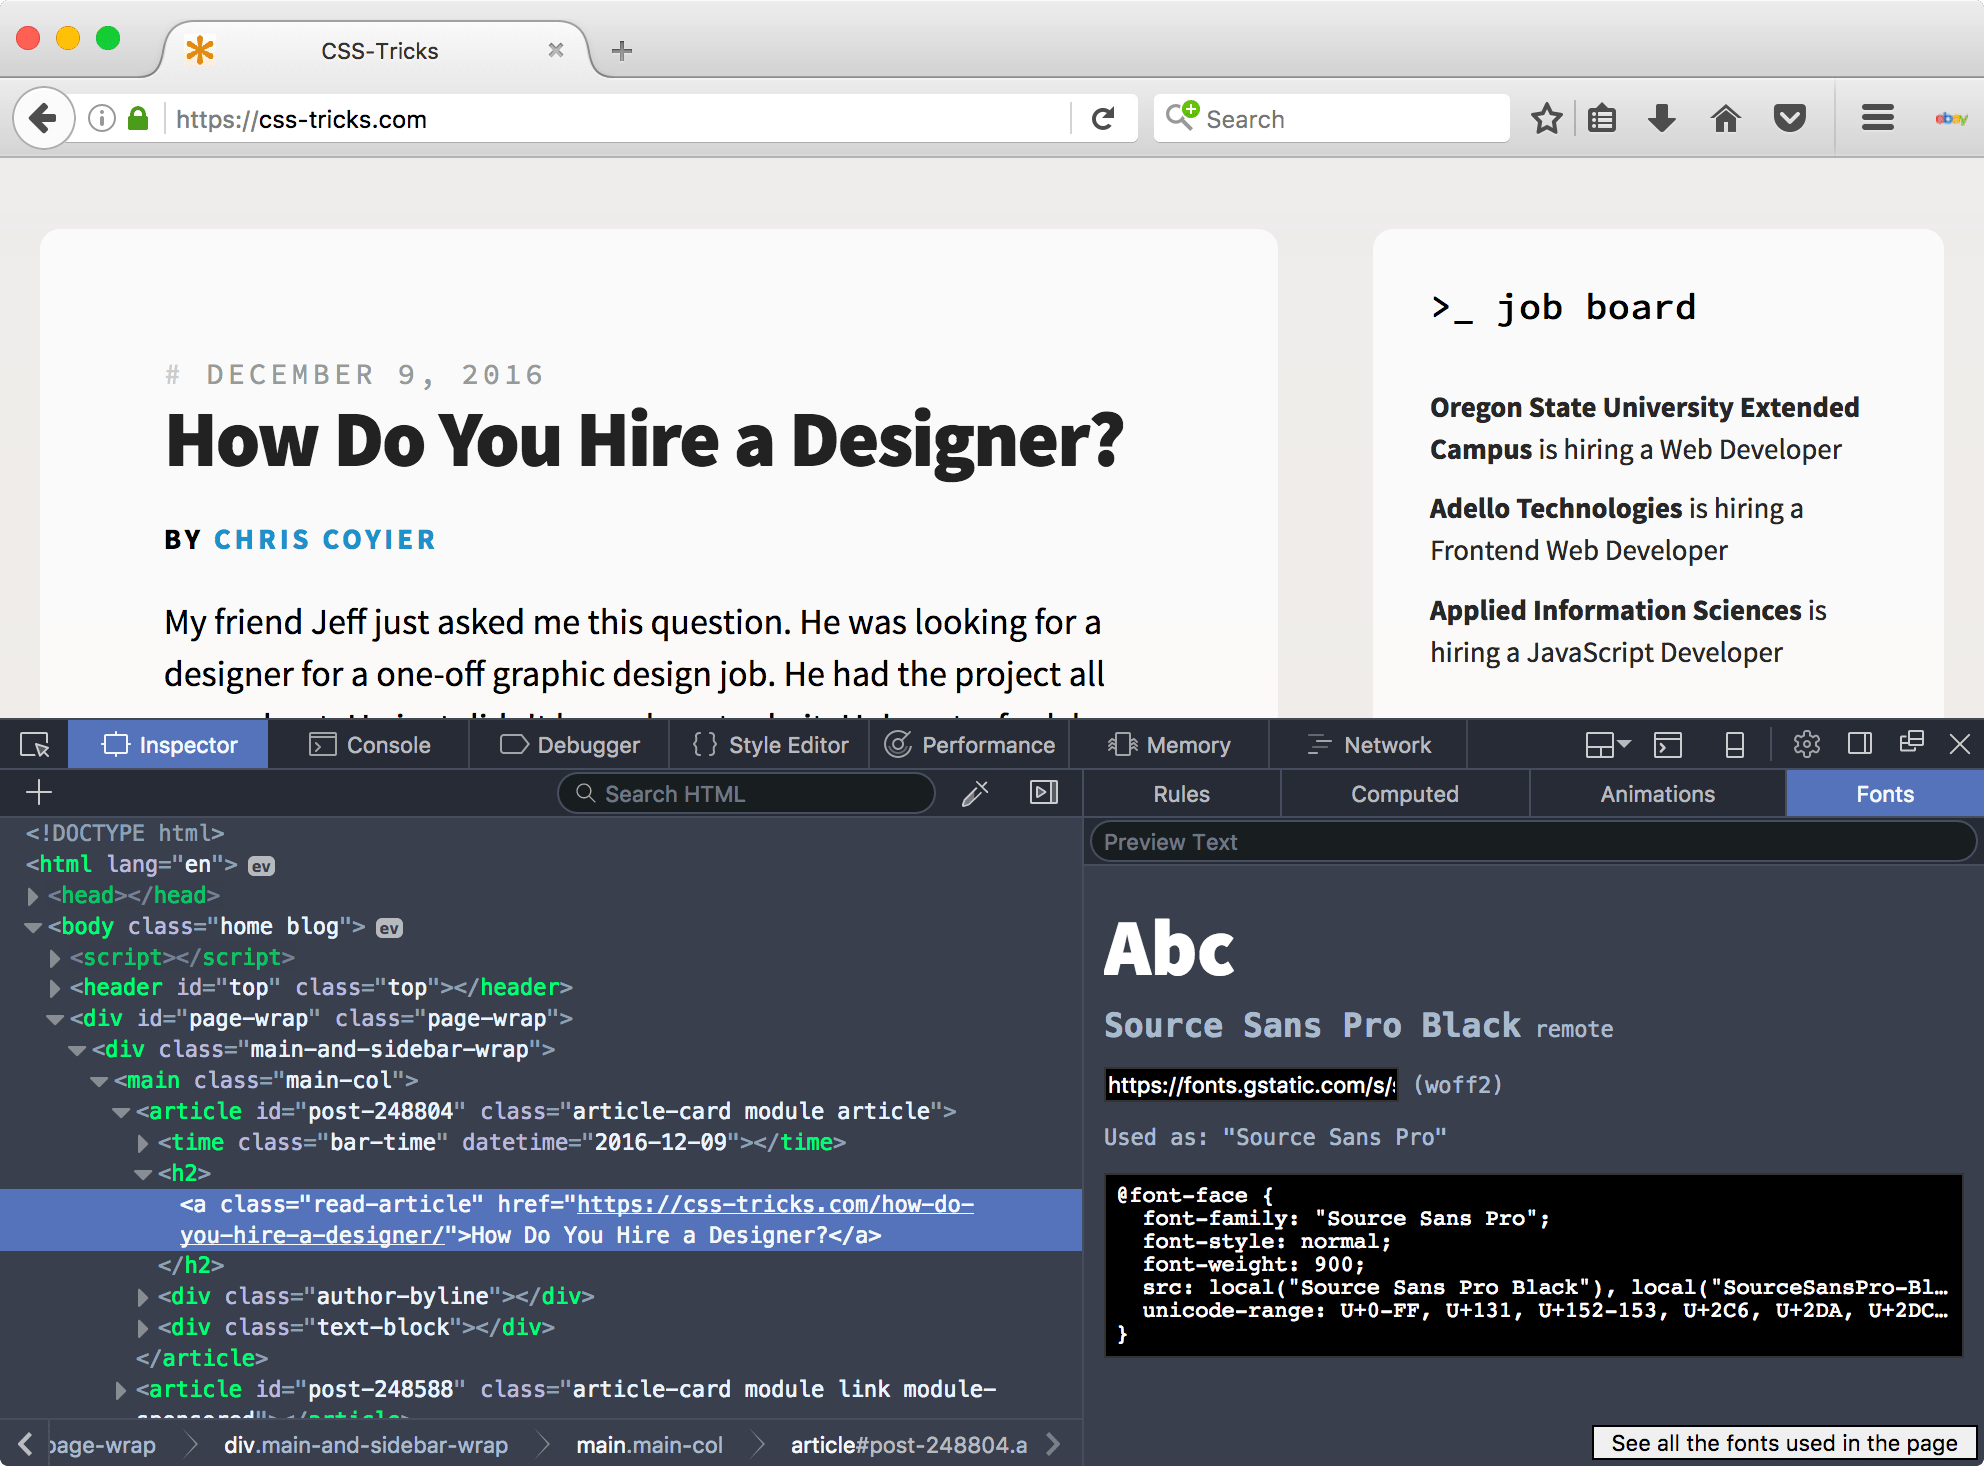
It’s pretty neat that it tells you not only how to use that @font-face rule, but also the location from which the font is being requested as well. My favorite button here though must be the “See all the fonts used in the page” button which sits in the bottom-right hand corner. Once you’ve clicked that you can see every font-family that’s been declared in the stylesheet that’s served to the page:

I can see that being super helpful in larger codebases where you might accidentally have lots of fonts being declared inconsistently.
Performance tab
After you’ve hit the ‘Performance’ tab and refreshed the page, you’ll see a waterfall of every resource that’s been requested. But did you know that you can see this data in the form of a graph, too? Here’s how that works:

This is a great tool to identify bigger problems in performance—perhaps you have a massive stylesheet being requested by the browser, and from here you’ll be able to see the scale of the problem faster.
Wrapping up
Here’s the thing: the more we experience how other browsers work, the more we learn about how different users experience our websites. Understanding how developer tools differ was useful in this instance, but learning about how unfamiliar browsers look and feel is enlightening as well.
For the next step in my experiment, I want to try out more mobile browsers because I imagine the differences between them are even larger than those between desktop browser apps.
What tricks have you learned from your non-regular browser lately?
I used to have a blog draft post called “Why I prefer Chrome”. I started it maybe 2-3 years ago. In the last six months or so, I deleted it. Not because I don’t prefer Chrome anymore (I also have Chrome bias), but because none of the points I was making were particularly strong, and many of the things that were unique to Chrome at the time aren’t so anymore (like having excellent DevTools).
One fairly big advantage Chrome has is that “each tab is its own process” thing. So they can freeze and not force every other tab to be frozen too. At least, I THINK that’s still unique to Chrome (or Blink, anyway). Wasn’t that one of the big reasons for the WebKit/Blink divide? And Firefox has said they are working hard on having that feature… I think? I might be behind on this info.
For data’s sake… here’s the last 30 days of browser usage on CSS-Tricks:
You’re a little bit behind, yes. Mozilla is in the process of rolling out their Electrolysis (or e10s) multi-process architecture for Firefox to the userbase at large. Starting with those users that don’t have browser extensions installed (which could mess with the new multi-process nature of the system).
Firefox also now has better tab management; it’s bookmarks are second to none (multi-dimensional tags) and last point to be honest is that this is a website for web pro’s. The figures we see on client sites vary with less educated users still sticking to stock browsers in construction and manual labor businesses. Fashion clients seem to have Safari as #1 with chrome as top 5, but even more interestingly we’ve seen a trend over the past 2-3 years of mobile to desktop behaviour where 2/3 of users browse on a mobile, then convert on desktop / pc.
Just to add an alternative view, here is my companies (public sector) website stats for the last month. The majority of our traffic (about 60%) comes to read new, the rest to access services and advice.
Firefox has been dropping like a stone over the past few years for us.
Gah, the image was missing from my response
Chrome 35%
Safari 27%
Safari (in-app) 21%
IE 8%
Firefox 3%
Edge 2%
First off, great content. While Chrome might be the browser of choice for X number of people, that’s fine. Y number of those people are not developers. I despise Chrome’s F12, if I gotta get to the dirt of a page it’s Firefox all the way. And sometimes you’ll be developing in Firefox and pull it up in chrome and it’s all wonky, that’s where Chrome excels is pointing out the things that Firefox fixes FOR you. So you gotta go back in and make Chrome happy because of it’s ‘market share’. Ultimately though, Firefox has the better development tools. I used Firefox when it was ‘Phoenix’ (c2001 ?). I haven’t looked back. So if browser snobbery is what we’re talking about, mine would be Firefox.
But… Chrome has a dark dev tools theme too :)
If there’s such a thing as Chrome bias, I probably suffer from Firefox bias. That’s why I installed Opera just the other day (but not really used it yet.) Between Chrome and Firefox I see no killer features in either of them. I like it though that the latter is not by any of the known moguls. Plus that a restart will only load the pinned tabs and the focused tab, not all tabs.
I honestly don’t know why everyone loves Chrome so much.
I was never able to make the jump from Firefox to Chrome (I tried, several times), and about a year and a half ago I switched over to Safari and use that almost 100% of the time, now, except for testing.
To me, Safari has always felt faster than other browser – including Chrome. Although, there is nothing scientific about that. That said, I have tried to jump ship from Chrome to Safari and never could – mainly because of the developer tools and a few extensions that are important to me.
Chrome’s best difference for me is easy multi-profiles. Firefox has multiple profiles too but after all these years an extension is still required to make it accessible, and it’s still clunky. Also Chrome has offline support for Google work & email. But Firefox has better bookmarks, it seems faster on desktops and the flipside of Chrome’s process per tab is high RAM use , the Android version of Firefox has add-ons and a great reader mode with dark mode. Now that I’ve moved from Mac to xubuntu where Firefox is default, I’m using it more.
Chrome does have a dark theme too, but that’s a somewhat recent addition. Firefox was certainly first to the game there.
My dev flow is Chrome where I do my development, and then to Firefox next to get an idea of cross browser compatibility. Firefox dev tools are no doubt fantastic and comfortably similar to Chrome which makes it a really nice go-to secondary browser for me.
It is interesting to me that IE traffic still has the edge over Edge (pun intended). And that is even with a developer-centered community. I wonder if IE represents more non-US users or perhaps visitors from large(r) corporations?
What I’ve noticed is that most people I’ve worked with over the years have a “Chrome Bias”. I actually use Chrome for most of my personal and work activities, but I almost always develop in Firefox. Part of the reason is actually because others are using Chrome. It allows me to spot other problems that Chrome may otherwise miss or which affect it differently. Helps us QA early and often.
No one I currently work with uses Edge/IE as a daily driver, but that used to be the case and it helped us spot issues early there too.
My biggest issue with FF Dev tools is that debugging is harder than in Chrome. I cannot break on a line and then inspect DOM. And source map support is also not good in FF.
I admit I have Chrome bias too.
It’s not always been like this – I used to know IE and Firefox pretty well. The problem is that I feel so comfortable with Chrome DevTools that switching is hard. I can debug and analyze alright with Firefox, IE/Edge and Safari, but with Chrome I can do a lot more.
The fact that Chrome is almost always on the edge of new technologies and standards doesn’t help either. Fortunately, nowadays when something works in Chrome usually works in other browsers too. A manual check is always necessary, but for the most things I’m doubting of, caniuse.com and MDN are my friend.
By the way, Chrome added a dark theme too (we have just two, though… I wish we could use whatever we want) and font analisys, although not as good as Firefox’.
The best dev tools still come from Opera and are named Dragonfly. Unfortunately the stopped working on and with them a few years ago and every hope of some of it’s features finding their way into Blink has to be abandoned by now…
I don’t have any kind of development bias because I consistently check my work in various browsers . . . except for IE/Edge. I typically ignore IE and Edge solely because I run Linux which Microsoft doesn’t build a version for. I mean, I don’t actually want IE or Edge but I will occasionally load up a Virtual Machine to test out some stuff. Anyway, I have seen many examples of Chrome Bias and honestly it’s infuriating because it just reminds me of the Internet Explorer Bias of the Dark Internet Era. Sure Chrome/ium Bias is 1,000x better than IE Bias but vendor lock-in is terrible regardless of how good the vendor is.
I actually prefer Firefox over Chrome solely due to the Bookmarks system. As @Lewis Cowles said, Firefox’ Bookmarks system is second to none. Chrome’s system is laughable in comparison. The only browser I’ve found that comes close in this aspect is Vivaldi but they have garbage import tools and no export tools so it’s just not there yet to be able to switch to it. Vivaldi has potential as they have said they plan to improve those features.
Overall, I do notice that Chrome is faster at rendering pages when compared to Firefox but Firefox has a better infrastructure workflow in my opinion though that is mostly due to the Bookmarks system. (well now that Tab Groups was removed, though I still use it with an addon.)
Being on Linux should prevent you from testing in Safari too though? For Edge you can at least get a VM which is not great but better than nothing. I have always and still develop on Windows Firefox but actually like Edge too which I use (privately) as my main browser.
Debugging esp performance debugging sometimes even feels easier in Edge. But sometimes I look at error messages in all 3 (C, FF, E) as all have different sometimes helpful or sometimes not helpful ones.
Sadly it is impossible to test Safari when working on Windows :(
Well I like chrome but I am start using the developer tool of Firefox recently. I like chrome’s nifty interaction with their users, even if you have no internet connection it has dino game to kill time for us.
Both chrome and Firefox are really good. But I noticed no one here is talking about browsers which are not main stream. Which may are may not be chrome based like Vivaldi, Brave ,Maxthon ,Comodo IceDragon etc …. It is always good to try different new things.
One of the coolest features I found in Firefox was 3D view. Really helps you to visualise the layout of the DOM. However, it looks like it’s been deprecated and removed from Firefox 47 onwards. [Tilt 3D(https://addons.mozilla.org/en-GB/firefox/addon/tilt/)] is apparently a suitable replacement for it. Not sure if there’s a similar extension for Google Chrome.
I used to be a Chrome user, but I switched to Firefox a couple of years ago. Chrome simply eats too many resources.. Mainly because I am a person who likes to have a lot of tabs open – over 100 is not uncommon! :p
I probably should give Chrome a chance – at least for testing my code, finding bugs, etc.
Google do have a tendency to ship buggy ‘things’, and I prefer a rock-solid workhorse, like Firefox, over shiny Chrome.
I forgot one other strong reason why I prefer Firefox over Chrome: privacy.
I sort of feel uneasy using a browser made by Google, since I am already tracked where ever I go.
The privacy, open source is a big one for me. I like the idea that there’s one independent browser maker still fighting the good fight. I would use Opera previously, but them being bought by the Chinese had me leery for those same privacy concerns. So now for WebKit I use Vivaldi, since it’s built by some former Opera folks.
Great article! One little thing I’ve been doing is adding this to the browsersync part of my testing task:
browser: ["firefox", "google chrome", "safari", "opera"]I find it’s a little harder to ignore browser bias when every browser automatically opens up for you.
I’m the other way, I need to actually be prompted to look at stuff in Chrome. I used FF back to the Firebug days and find that their dev tools feel like a spiritual successor to it. I’ve tried to switch a few times to Chrome, but have never liked their dev tools. Could be just personal preference, but I’ve just found the CSS style inspector has pretty much always been better for one reason or another. I tend to use Vivaldi now if I need WebKit. It’s just sexier than Chrome, straight up.
Thanks! I’ve installed Vivaldi, it seems to be a sexier option than Chromium/Chrome. :)
I switched over to Chrome for FE dev a while back, when I found their responsive previews to be very accurate where Firefox’s were not so much. But I just recently saw in Firefox Developer Edition that they added similar robust mobile preview options (eg: simulating pixel density) in their dev tools as well! So, I might jump back to FF when that comes to the stable release.
FF has scratch pad though :) And Firebug (if extension installed) comes with a multiline console which is propper handy.
Firefox Dev Tools has a nice feature over Chrome not mentioned here: I can see what JavaScript event behaviors are assigned to elements in the DOM inspector. I have to go digging deeply in Chrome’s DOM properties tab to see what is hooked in, and even then, I have to know what I’m looking for.
This is a Firebug rather than a Firefox thing, but Firebug’s cookies tab is much more user-friendly than Chrome’s.
In addition addition to Chrome’s “Dark Mode” the DevTools Author extension (http://mikeking.io/devtools-author/) provides 24 themes out-of-the-box for the dev tools. Pretty neat.
One thing I like about Firefox is their Javascript info in the inspector tab. When you click on “EV” right next to an element, it shows every useful information about javascript applied on that part. I liked that every much. Firebug also is an excellent reason for using FF. When you see source code of a page, FF shows incomplete tag of error in HTML in red color. i like that feature very much.
I don’t particularly like Chrome. However, if you develop for mobile a lot then it’s foolish to not use it as it’s going to get you close to the way things will render on Chrome Android.
Likewise, Safari performance is far better on my macbook (battery life much improved) and developing on that is going to get you rendering very close to iOS (and older Android browsers).
Firefox, as a browser, is excellent. I also find it tends to be, anecdotally, closer to the specs when it comes to rendering/layout. However, there’s no mobile platform equivalent so I don’t use it much. If I develop on that first, I then have more work to do getting things looking right on Chrome/Safari.
Sadly, I think Firefox is doomed without a compelling platform to make it a necessity.