The following is a guest post by Catalin Rosu, who along with some colleagues, dug up a ton of data about the HTML content of web sites. This is the most recent study of its kind and wildly fascinating to see the results. I find it especially fun to compare the top results to what I would have guessed would have won.
We’ve all been there. We try to improve our HTML code making it clean, beautiful, and readable. We do this in pursuit of better semantics and better accessibility, so that everyone can use it. It’s our top priority. And we always have questions:
- What is the best way to structure the markup?
- How are others doing it?
Questions like these were running through my mind. I wondered about how people write markup these days, as new web technologies emerge. So, I teamed up with a few of my colleagues at AWRCloud and we came up with a data set of over 8 million pages from Google top twenty results.
The studies that came before this one
Back in 2005, Ian Hickson, the editor of HTML5 specification, made an analysis of a sample of slightly over a billion documents, looking to see what the web is made of. A billion is an enormous number, but to Google, nothing is impossible. With this huge amount of documents, he extracted valuable information about popular class names, elements, attributes, and related metadata. The outstanding results were later published as Web Authoring Statistics, which is still the most powerful web authoring study ever made.
More recently, in 2008, the Opera Metadata Analysis and Mining Application crawler, MAMA, ended up analyzing about 3.5 million URLs. Brian Wilson, the author of this impressive work, expanded the study by publishing results detailing page structures, including HTML, CSS, and JavaScript.
One of the analyses from Web Authoring Statistics that later proved vital for the work in progress HTML5 development, was a list of the most popular class names in those HTML documents. The Opera MAMA crawler also searched for the most common class names and in addition to Google’s results and they’ve published relevant results on the popular ID attribute values given to elements as well.
What does this study add to the conversation?
The data for this study comes from 8,021,323 index pages gathered from the top twenty Google results for about 30 million keywords, chosen by keyword volume. Meaning: we had 30 million keywords. We ran a Google search for each of them and took the URLs for the top 20 results and added them to the list and removed the duplicates.
We can only assume that the relevance of these web pages to the general web population is very high. That is based on the likelihood these are popular and high-trafficked websites commensurate to their search result positions.
How fresh is this data?
The latest data set is from May 20th, 2016.
This new study will never surpass the former study Google made back in 2005. It’s not about overcoming Opera’s great study either. It’s about finding new and relevant insights on the actual markup used by the most popular and successful web pages on the internet.
So, how does the average HTML page look like nowadays? Take a look at the screenshots below and check out the study for the full statistics.
The Stats
Following our study, we find that the average website index page uses twenty six different different element types.

The twenty six elements used on the most pages, ordered by frequency:

<head> and <html> are used on all sites. Slightly surprising with <body> at 99% – perhaps a very large website with a weird mistake? The table elements at the bottom of the list are still on a surprising nearly-third of all websites.Among the document type declarations that specify which version of (X)HTML a page is using, the latest HTML5 doctype is clearly leading the way.

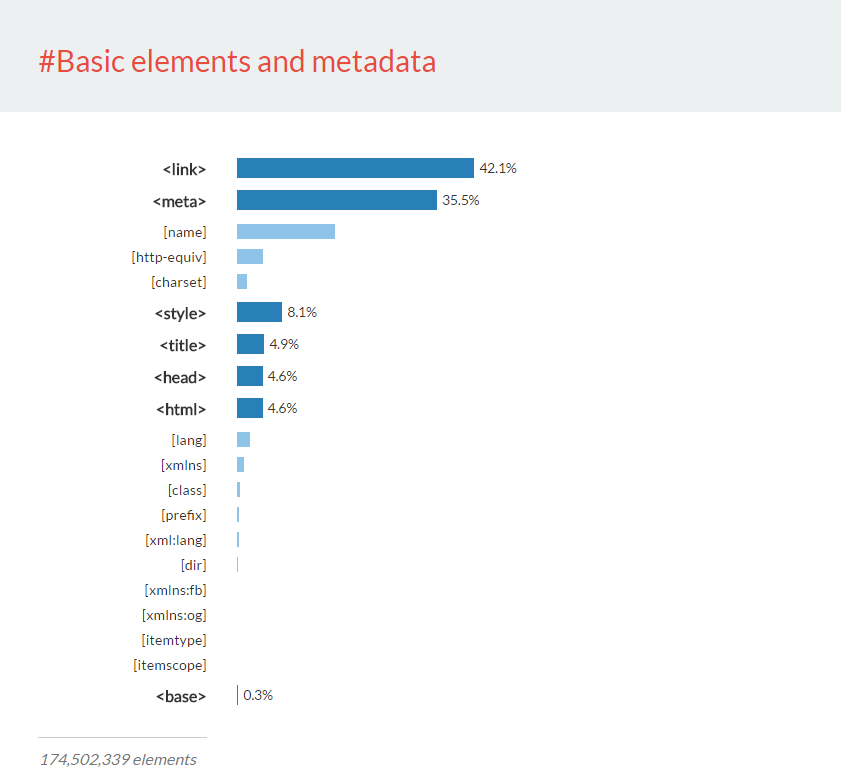
If we look at all the elements that are specifically about telling browser or search engines about the site and how to style it, we found about 175 million elements, and here’s how they broke down:
The breakdown of the 105 million elements for content sectioning looks like this:

<h3>s are the most popular heading elements and overall content sectioning element.Of the billion text content elements:

<div> has a commanding lead.What’s the future of web?
Us web developers and web content creators are curious and interested in usage, statistics, and browser support. These are the things that led to the class names findings back in 2005, names known today as the most popular HTML5 tags.
The web is evolving fast. This isn’t new, but it can feel overwhelming. The trends are changing from year to year and as a web content creator, it requires motivation and effort to stay up to date. Think about how the markup and the average web page looked like ten years ago and how a modern web page looks like today.
We also used the study to look at emerging technologies like Web Components. While Web Components allows authors to create arbitrarily named elements, we can look for standards elements used in the creation of Web Components.
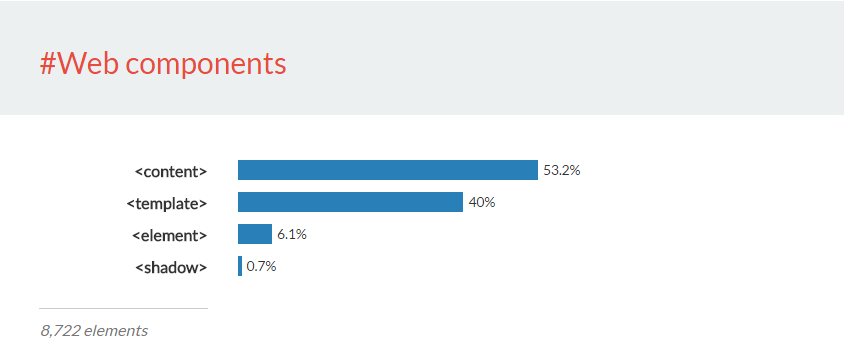
Nobody can predict the future. We can only guess how the average web page will look like ten years from now on. Next time we run this study (we’re considering quarterly), will we see things like Web Components rise?
And again, the complete data set is here.
“The table elements at the bottom of the list are still on a surprising nearly-third of all websites.” Why is this surprising? Tables aren’t being depreciated. They are the semantic way you’re suppose to display tabular data. I’m sure a lot of websites have data they need tables for.
Although let’s be honest, much of those tables across the internet are being used for page layout, but let’s not blame that on the table element.
I wrote that line – and yes – I do think it’s surprising that a third of all webpages have tabular data on them.
Seriously, Chris? A lot of data is still easily and efficiently represented in a table, and clients still have a twisted love for them despite their terrible responsiveness. Almost every website I’ve ever made has used at least one table somewhere. Take ecommerce sites for instance, almost every one of them will use a table somewhere, be it for product details or shipping information.
I think the most surprising thing here is that someone so deeply embedded in the web industry hasn’t noticed the persistent prevalence of tabular content on websites.
I’d like to also add that I’m surprised I’m not allowed to be surprised about something.
For what it is worth, I agree with Chris. I don’t think there is that much tabular data out there. Check Yahoo.com for example, there is a lot of mixed content there and still, they use
<table role="presentation">to address a style fix, not for tabular data.Hey guys,
Maybe the surprising thing is the need to display tabular data precisely on the index pages. Don’t forget the above info is for the index pages only.
I’m thinking here about the current layout design trends and how they – don’t really – fit with tabular data.
Is the use of div and grid system preferred more over a table ?
It absolutely classes as surprising. There being a valid use case for tables certainly doesn’t equate to there being a need for tabular data on a third of all websites.
I can barely even think of examples of what an average website would show in a table.
What’s also surprising is that it seems like there are websites out there that use
<table>but not<td>Neopets may have skewed the averages a little. They haven’t done a redesign in many years, and every single page of theirs is formatted with several nested tables. Every. Single. Page. Has. Several. Nested. Tables. It makes me dry-heave just thinking about it, and it’s where I first learned to write HTML and CSS as a kid. My code is written as bare-bones, literal, and minimalist as possible in silent rebellion to this day.
I think the 97% for
<title>is more surprising since tag omission is allowed for<body>but not for<title>I guess that 99% for body is proof that the pages were analyzed as served documents and the DOM post
document.ready(in which 100% of pages would have a body). I wonder how that would affect things.I’m curious about the 10.4% of pages that don’t contain any anchor elements. Any suggestions?
perhaps because you can attach actions to mouse input/events without the need for an anchor tag?
Hi Jonathan,
10.4% of pages with missing anchor elements is definitely something to look into. I’ll dig further and hopefully get back with some interesting facts.
Think also there are some websites with a landing maintenance page without links
To me the most surprising finding is in your list of the top 26 elements: strong is there but b is NOT! That shows a shift in usage toward the more semantic approach, although no doubt it also reflects a shift to the use of CSS for altering character weights.
The table question is interesting. Given that your survey was of top-20 sites, and reinforced by the large adoption of the HTML5 doctype, it appears that your sample is heavily weighted toward modern actively maintained and updated sites whose scale requires that they pay attention to new developments and best practices. If that is so, then perhaps you should re-examine your questioning of the still-substantial use of tables. Maybe these site developers have actually found a balanced usage of structured rows and columns where that is indeed the best way to present certain information. Could your future survey delve into HOW tables are used – grossly speaking page structure vs tabular data?
Finally, you say that the h3 element is the dominant heading used for content sectioning. But in the top 26 elements list, h1 and h2 show considerably higher usage than h3. Are these referring to different things?
Thanks for doing this!
Hi Brue,
I agree this part might sound confusing but let me try make things a little clear.
Among the most used 26 HTML elements, the
<h1>and<h2>are leading in front of<h3>because it’s about the frequency, not the total number of appearances. So it’s most likely a page to contain a<h1>or<h2>rather than a<h3>.On 8,021,323 pages, we’ve counted a total number of 105,017,877 content sectioning elements. Here it’s about the total number of appearances only and it seems that the
<h3>is in charge.Hope that helps! :)
I’m mostly saddened (but not surprised) to see that dropdown menus (composed of several < option > elements) make up 50% of form elements. There’s almost always a better option, as noted in the delightful presentation at f-u-c-k-dropdowns.com [minus the dashes] (I have no affiliation, just think all designers should watch)
What a funny studies. Seems there is another kind of simple websites using just only 9 types of html tags. Short and clean.
Glad you noticed that too.
I made a check and there are 362.769 websites that are using only 9 different HTML elements, comparing to 473.631 websites that are using 26 elements.
Using only 9 types of tags is not necessarily “short and clean” and could just as easily be long and dirty.
I imagine two likely cases for a curious spike at exactly N tags (here N==9) and am interested to know if Catalin notices if either is the case.
a) divitis
— I see many sites with deep nesting of
<div>s as wrappers of wrappers of wrappers, often as part of building a site based on a framework system. You can often tell which framework too, based on the classes on the divs.b) Automation
— If you have E-Z Site Builder v3 churning out pages according to a template, many similar pages & sites would inflate the data at the N point. Since automation generally can’t infer semantics things tend to turn into generic divs.
Stephen,
That’s very interesting.
Right now I’m only thinking about checking out the “divitis” scenario for all the ~300k websites that are using those 9 different elements only.
We ran some queries for the ~300k websites that are using only 9 elements per page and here are the numbers we’ve got for the top 15:
meta 2,056,149
script 687,084
link 369,959
div 346,548
head 253,189
html 252,865
title 252,751
body 251,831
p 131,922
h1 116,473
style 112,121
a 72,571
li 53,858
br 15,975
frame 14,414
The above are the total number of HTML elements found within ~300k pages.
Not two thirds, but about 52.5%, if I’m reading the data correctly. Of the 8M pages, only about 6.4M have a doctype to begin with. The data is presented in an unusual manner, and the relative percentages aren’t very useful when the elements work in conjunction with each other (e.g. area vs map).
Hi Šime,
That’s a good point, it’s two thirds of websites that specify a doctype indeed.
Also, regarding the data representation, that was one of the decisions I had to take at the beginning of this project. And while searching for an interesting way to group HTML elements by functionality, I stumbled upon this impressive MDN resource.
Definitely interesting.
I’d like to suggest that missing 1% of body elements might be due to frameset pages. Old and deprecated, but still in use.
I’m more surprised about 11.5% of script-less sites. Maybe they’re all front, presentation pages?
The missing 1% of body elements is again something to look into.
I guess the only way to check this out is to run the parser again with these custom settings and hopefully get some interesting insights.
Awesome study! I love to see breakdowns like this. I am curious why
<div>is included in Text Content and not Content Sectioning. Older pages (HTML 4.01) would most likely use<div id="header">instead of<header>, so I am curious about how you decided to break down the stats into the categories you chose. I look forward to the next study to find trends!Brian, the above categories were chosen based on MDN‘s HTML element reference.
Any chance you can open source the data? I’d like to dig a little deeper into these stats.
Why so many tbody elements? Is this optional tag seriously used as frequently as table tag or is it something the user agent added to dom?
I just tested with a simple table, and Chrome, Safari, and Firefox all insert
tbodyelements automatically.I think it’s also worth pointing out that this data surely only reflects the English-language web.
Of the 8,021,323 pages that we were able to parse, 5,368,133 use the lang attribute on the
htmlelement. That’s about 70%!Check out below the breakdown for
langattribute values:– en-US 2,688,150
– en 2,104,991
– en-gb 267,844
– en-GB 120,406
– en-us 54,480
– de 40,250
– fr 26,156
– en-AU 24,133
– es-ES 21,561
– fr-FR 20,162
So yeah, 99% English
Many frameworks such as fontawesome.io use the
<i>tag for icon markup in HTML. This might account for<strong>(3.4%) being more popular than<b>(2.3%), but oddly<i>(2.8%) is still dominant over<em>(0.8%). Thoughts?Within the total number of inline elements (936,760,353), 2.8% (26,229,289) of them are
ielements.I dug a bit deep into the
ielement stats only and here is the top 15 for<i class="*"></i>:fa fa-angle-right – 696,960
fa fa-twitter – 561,335
fa fa-clock-o – 543,666
fa fa-facebook – 498,275
fa fa-angle-down – 455,119
ddc-icon ddc-icon-chevron-right – 448,404
fa fa-user – 439,849
fa fa-star – 409,194
fa fa-search – 397,014
fa fa-google-plus – 307,473
fa fa-shopping-cart – 307,700
ddc-icon ddc-icon-arrow2-right – 296,082
fa fa-bars – 254,183
fa fa-heart – 241,411
fa fa-envelope – 244,036
Font Awesome FTW!
Within the total number of inline elements (936,760,353), 2.8% (26,229,289) of them are
ielements.So, I dug a bit deep into the
ielement stats only and here is the top 15 for<i class="*"></i>:fa fa-angle-right – 696,960
fa fa-twitter – 561,335
fa fa-clock-o – 543,666
fa fa-facebook – 498,275
fa fa-angle-down – 455,119
ddc-icon ddc-icon-chevron-right – 448,404
fa fa-user – 439,849
fa fa-star – 409,194
fa fa-search – 397,014
fa fa-google-plus – 307,473
fa fa-shopping-cart – 307,700
ddc-icon ddc-icon-arrow2-right – 296,082
fa fa-bars – 254,183
fa fa-heart – 241,411
fa fa-envelope – 244,036
Font Awesome FTW!
So the 15 most common uses of the
<i>tag made up about 5.5 million of 26.2 million<i>tags.How many of the
<i>tags didn’t have a class and had something between the opening and closing tag? That is, how many were likely being used for something other than an icon font element?Joan, hard to tell but not impossible :)