The developer’s debugging console has been available in one form or another in web browsers for many years. Starting out as a means for errors to be reported to the developer, its capabilities have increased in many ways; such as automatically logging information like network requests, network responses, security errors or warnings.
There is also a way for a website’s JavaScript to trigger various commands that output to the console for debugging purposes. These commands are contained in a console object available in almost every browser. Even though these features are mostly consistent between browsers, there are a few differences. Some of these differences are simply visual in nature while others do have slight functional differences to keep in mind.
For the curious, here’s the spec by WHATWG linked from the MDN console docs.
This guide covers what’s available in the console object of Firefox and Chrome as they are often the most popular browsers for development and they do have a few differences in various aspects of the console. The new Chromium-based Edge is essentially the same as Chrome in many ways so, in most cases, the console commands will operate much the same.
Quick Links
The console.log command
The first thing we can do is log the console object itself to see what your browser of choice actually offers.
console.log(console);This command will output the various properties of the console object as the browser knows them. Most of them are functions and will be rather consistent regardless of browser. If there are differences in the properties of the console object from one browser to another, this way you can see the differences. One such difference I can point out between Firefox and Chrome is that Chrome provides a “memory” property that outputs some basic memory usage stats. Firefox doesn’t provide this property and yet has a “name” property that Chrome does not have.
Thankfully, most of the differences between the browsers tend to be just as trivial. That way, you can be fairly confident that your code will output much the same regardless of the browser in use.
First things first: clear()
With heavy usage of the console comes a very crowded output of text. Sometimes you just want to clear things out and start with a fresh console. Browsers typically provide a button in DevTools that performs this task. However, the console object itself also provides a command to handle this:
console.clear();This will clear the console and will helpfully inform you of that by outputting a message like “Console was cleared.”

Common usage: debug(), error(), info(), log(), and warn()
There are five commands that at first glance seem to do the exact same thing. And, technically, they do. But browsers provide additional features tied to the five commands to give each their own distinct benefit.
These five commands are:
console.debug();
console.error();
console.info();
console.log();
console.warn();
I’m sure many of you have seen console.log() before (I mean, we just talked about it up top) and have probably used it before. Before we get into what you can log in these five commands, let’s see our first minor difference between Chrome and Firefox.

This is an example in Chrome of each command outputting a string, such as console.debug('console.debug()');. Notice that some of them have a color treatment to give a visual indication of the type of output it is. The error and warn outputs have an additional icon for even easier identification.

Here is the same list in Firefox and, while it looks similar, there are three minor differences. For example, console.debug() is not color-coded and console.info() has an additional icon next to it. In Chrome, both console.error() and console.warn() can be expanded to show additional information about the output while Firefox only does this with console.error(). This additional information provides a trace of the lines of code involved to get to where the particular command was called.
One thing that is useful about these five commands is that the browsers provide filtering options to show or hide each type as you wish. Firefox has them right there at the top of the console above the output while Chrome hides them in a dropdown, labeled “All levels” which you can see in the earlier Chrome console screenshot. “All levels” is there because I have all five set to be shown. If you were to choose the “Default” option then the debug output (listed as “Verbose”) is hidden while the others are shown. Unchecking “Info”, “Warnings”, or “Errors” causes the dropdown to display a different title such as “Custom levels” or “Errors only” depending on what is selected.
The intentions for usage of error and warn are easy to determine; how to use the other choices is up to you. If you do make extensive use of the different options then you might consider documenting the expectations of each as to not confuse things late in the project — especially if it is a team project.
Now, let’s discuss what we can actually log inside these commands. Since they all behave the same, I’ll just focus on logging as the example.
The simplest examples involve just passing a string, number, object, or array into the log command. Technically, any of JavaScript’s data types can be used, but for most of them, the output is much the same.
console.log('string');
console.log(42);
console.log({object: 'object'});
console.log(['array', 'array']);
I’m showing these examples in Chrome with the object and array already expanded. They are normally collapsed but the output next to the arrow is consistent between both states. Firefox displays a little differently but, for the most part, the output is the same. Firefox does tell you whether it is displaying an object or array before expanding, but shows the same as Chrome while expanded.
One interesting thing to add is that you can pass more than one item to the log as parameters and it’ll display them inline.
console.log('string', 'string');
console.log(42, 1138);
console.log({object: 'object'}, {object: 'object'});
console.log(['array', 'array'], ['array', 'array']);
Often when I’m working with x and y coordinates, such as what can be outputted by mouse events, it’s useful to log the two together in one statement.
String substitution
The different console logging commands provide string substitution that allows inserting different values into the string for output. This is useful for describing a variable in the log to make it clear as to what’s being reported.
console.log('This is a string: %s', 'string');
console.log('This is a number: %i', 42);
console.log('This is an object: %o', {object: 'object'});
Here is a list of the data types that can substituted into the output string:
| Data type | Substitution symbol |
|---|---|
| Objects and arrays | %o or %O |
| Integers | %d or %i |
| Strings | %s |
| Floats | %f |
The first parameter would be the string to output with the symbols placed in the appropriate locations. Then each parameter after that is the value to substitute inside the first parameter’s string. Keep in mind that you’ll have to keep the substitution types and the parameters in the specific order or you’ll get unexpected results.
If your console supports template literals, it’s a bit easier to get similar results as string substitutions.
console.log(`This is a string: ${'string'}`);
console.log(`This is a number: ${42}`);
console.log(`This is an object: ${{object: 'object'}}`);
Notice that the object is handled a bit better with the string substitution, so pick the appropriate choice for your requirements. Since it’s possible to insert more than one value in the output, let’s compare the two.
console.log('This is a string: %s. This is a number: %i', 'string', 42);
console.log(`This is a string: ${'string'}. This is a number: ${42}`);
With the string substitution each value is added as a parameter to be inserted into the output. With template literals, on the other hand, you add them wherever they need to be in the output. Also, you can combine them.
console.log(`This is a number: ${42}. This is an object: %o`, {object: 'object'});
So, there are lots of options to pick and choose from so you can go with the best options for your needs.
Styling the output
Another potentially useful and fun thing is that you can apply CSS styles to the console’s output. It works just like the string substitution method where you insert a %c variable for styles to be applied from the parameters.
Here’s a simple example:
console.log('%cThis is large red text', 'color: red; font-size: 30px;');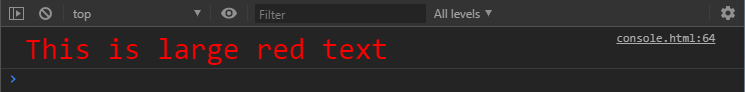
This time there is a slight difference in the Firefox output:
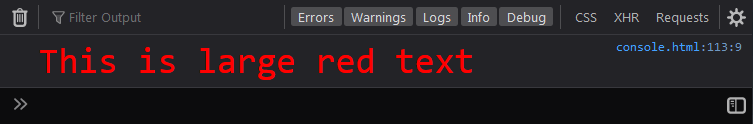
Not really that much of a difference, but something to keep in mind.
What essentially happens is that %c reads the strings in the parameters to determine what styling to apply. So, say there’s a second styling being passed, %c moves on to the next parameter, much like with string substitution. An empty string in the parameter list resets the styling back to default.
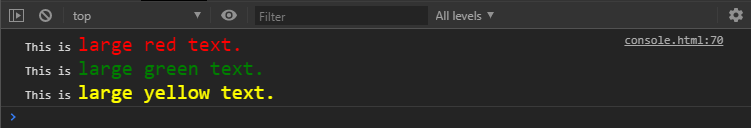
console.log('This is %cred text %cand this is %cgreen text.', 'color: red;', '', 'color: green;');
The styling properties available are rather limited when compared to typical CSS styling on a webpage. You can look at it as a sort of inline block of text that allow you to manipulate a limited set of styling properties.
With some work and experimenting, you could create interesting messaging within the console. One idea is to draw extra attention to a particular log, especially an error of some sort.
console.log('%cHello there!', `
  background: white;
  border: 3px solid red;
  color: red;
  font-size: 50px;
  margin: 40px;
  padding: 20px;
`);
In this example, we can see that the CSS is a bit verbose, but there is something we can do to mimic the class system that we leverage in CSS. The values of each parameter for styling can be stored in variables to allow for repeated use without having to duplicate the string of styles in each parameter.
const clearStyles = '';
const largeText = 'font-size: 20px;';
const yellowText = 'color: yellow;';
const largeRedText = 'font-size: 20px; color: red;';
const largeGreenText = 'font-size: 20px; color: green;';


console.log(`This is %clarge red text.
%cThis is %clarge green text.
%cThis is %clarge yellow text.`,
  largeRedText,
  clearStyles,
  largeGreenText,
  clearStyles,
  largeText + yellowText
);
There are several things going on here, so let’s break it down a bit. First, we have a collection of variables that holds our styling strings. Think of each as a sort of class to be reused in the parameters of the console log.
We are also using a template literal in the log, which means we can have line breaks in our output. Then, for each %c in the text, there’s a corresponding variable used in a parameter to define the styles for that particular part of the output text. In addition to each variable that holds styling, there is also a clearStyles argument that can be used to reset styles to prepare for the next set of styling. You could just use an empty string as in previous examples, but I like the clear intention that comes from using the variable name. The last parameter shows that the variables can be combined, which opens up more possible ways of handling the styles.
Now, that’s a great deal of text covering essentially five console commands that only output text to the console. So, let’s move on to other commands of the console object. Although, some of these can still use many of the features described so far, we won’t focus on that aspect as much with the following commands.
Being assertive: assert()
The console.assert() command is similar to the error command mentioned previously. The difference is that asserting allows for the usage of a boolean condition to determine whether it should output the text to the console.
For example, let’s say you wanted to test the value of a variable and make sure it wasn’t larger than a certain number value. If the variable is below that number and the condition resolves to true, the assert command does nothing. If the condition resolves to false, then the output text is displayed. This way you don’t have to wrap a console.error() command with an if statement to determine if the error message is needed in the first place.
let value = 10;
console.assert(value <= 7, 'The value is greater than 7.');
We can see that assert has the same appearance as the error command, except that it also prepends “Assertion failed:” to the output text. Chrome can also expand this output to show a trace of where the assertion came from.
The trace can be quite helpful with common patterns of functions within functions calling other functions and so on. Although, you can see in the example above that the line the assert came from doesn’t tell you how the code got to that line.
let value = 10;


function function_one () {
  function_two();
}


function function_two () {
  function_three();
}


function function_three() {
  console.assert(value < 7, 'This was false.');
}


function_one();
This sequence is actually in reverse order in terms of the code. The last line shows an anonymous entry (which is an HTML script tag in this case) on line 78. That’s where function_one was called. Inside that function, we have a call for function_two, which, in turn, calls function_three. Inside that last function is where the assert is located. So, in this development world of functions sharing other functions; a description of the path to that point of the assert is quite handy.
Unfortunately, this trace is not provided in Firefox with the assert command, as it is with the error command.

Keeping count: count() and countReset()
Ever wonder how many times a certain thing happens in your code? For instance, how many times does a particular function get called during a sequence of events? That’s where the console.count() command can help out.
By itself, the count command is rather simple and has limited use. If you use the command in its default state you only get a simple count. For example, if we call it three times in a row, we get a sequential count.
console.count();
console.count();
console.count();
As you can see, we get a simple count from one to three. The default behavior means that count is merely incrementing the output by one each time it runs, no matter where it shows up in the code. You do get the line number in the code where it happened, but the count is a simple total no matter the situation.
To make this command a bit more useful, we can provide a label to keep a separate count for that label.
console.count('label A');
console.count('label B');
console.count('label A');
console.count('label B');
console.count('label A');
console.count('label B');
Even though using the count command with labels causes the output to alternate between labels, each one keeps its own count. One scenario where this comes in handy is placing a count inside a function so that every time that function is called, the count is incremented. The label option makes it so that a count can be kept for individual functions to provide for a good idea of how many times each function is being called. That’s great for troubleshooting performance bottlenecks or simply seeing how much work a page is doing.
There’s a way to reset the count. Let’s say we have a loop that gets called multiple times, but the number of iterations of the loop can be dynamic. This is done with the console.countReset() command with the same label from the count command.
console.count();
console.count();
console.countReset();
console.count();


console.count('this is a label');
console.count('this is a label');
console.countReset('this is a label');
console.count('this is a label');
Each count — with and without a label — is called twice and console.countReset() is applied right before another count instance. You can see that Chrome counts up to two, then restarts when it encounters countReset. There’s nothing in DevTools to indicate the reset happened, so an assumption is made that it did happen because the count started over.
And yet, the same code is a bit different in Firefox.

Here, the reset is indicated by the count being set all the way back to zero. That is the indicator that the reset was called, whereas we have no such indication in Chrome.
As for label options, just about anything can be used. I suppose a simple way to describe it is that if you give it anything that can be resolved to a string, it’ll probably work as a label. You could even use a variable that has values that change over time, where count will use the current value of the variable as a label each time it is encountered. So, you could keep count of the values as they change over time.
Describe that thing: dir() and dirxml()
The main idea behind these two commands is to display either properties of a Javascript object with console.dir() or descendant elements of an XML/HTML element with console.dirxml(). It appears Chrome has these implemented as expected, while Firefox just uses both as aliases for console.log().
Let’s give console.log(), console.dir(), and console.dirxml() the same simple object to see what we get. Keep in mind that you normally would not log an object with console.dirxml().
const count = {
  one: 'one',
  two: 'two',
  three: 'three'
};


console.log(count);
console.dir(count);
console.dirxml(count);
dir() and dirxml() exampleFirefox gives us much the same, except the console.dir() is automatically expanded.

dir() and dirxml() exampleAnother simple comparison to console.log() is to repeat the object in the same command.

dir() and dirxml() double example
dir() and dirxml() double exampleNot really that much different other than that Chrome doesn’t show the second object in console.dir() like Firefox does. Which makes sense because Chrome is trying to display properties of an object (ignoring the second) while Firefox is just aliasing everything to a console.log(). So, for situations like this with objects there is little difference between console.log(), console.dir(), and console.dirxml() in the browsers.
A useful benefit of console.dir() in Chrome that I can point out is how DOM elements are handled. For example, here’s how console.log() displays in Chrome and Firefox when given a DOM element.

console.log() DOM example.
console.log() DOM exampleNow, I’ve always liked how Firefox outputs a DOM element inside a console.log(), as it gives you all the properties of that DOM element. So, when I wanted to look up a specific property of a DOM element to manipulate with JavaScript, it’s only a console.log() away to find it. Chrome, on the other hand, gives us the HTML code of the DOM element in the console.log() just like it would in console.dirxml().
To get the properties in Chrome, use console.dir() with the DOM element. I was quite happy to find that console.dir() in Chrome provides the properties of a DOM element just as I came to rely on that information in Firefox.
As for console.dirxml() in Chrome, it can be useful for displaying an HTML element and its children outside of the clutter of the DOM Inspector. You can even edit some of the existing HTML live in the console, but you won’t have the same level of abilities as in the DOM Inspector.
Let’s get together: group(), groupCollapsed(), and groupEnd()
Here’s a simple one: Group different console outputs together to show a form of relationship among them. It is somewhat limited in features so its usefulness will depend a great deal on how you plan to use it. This is the console.group() command.
console.group();
console.log('one');
console.log('two');
console.log('three');
console.groupEnd();


console.group('this is a label');
console.log('one');
console.log('two');
console.log('three');
console.groupEnd();
group() exampleIn the first block of code we call console.group() in its default state, have three logs, and then finally call console.groupEnd(). The console.groupEnd() simply defines the end of the grouping. The second block has a string as a parameter that essentially becomes the label for that group. Notice that in the first block without a label it just identifies itself as a console.group in Chrome while in Firefox it shows as <no group label>. In most cases, you’ll want a proper label to distinguish between groups.
Also notice the arrow next to the labels. Clicking on that collapses the group. In the code examples above, if we change console.group() to console.groupCollapsed(), they start collapsed and must be opened to see the output.
You can also nest the groups. The console.groupEnd() command simply refers to the last opened group.
console.group('outer group');
console.log('outer one');
console.log('outer two');
console.group('inner group');
console.log('inner one');
console.log('inner two');
console.log('inner three');
console.groupEnd();
console.log('outer three');
console.groupEnd();
group() exampleJust as a quick note, if you want the group label to stand out a bit more in a list of output in the console, you can style it just as we did with strings earlier.
console.group('%cstyled group', 'font-size: 20px; color: red;');
console.log('one');
console.log('two');
console.log('three');
console.groupEnd();
group() exampleHave a seat at the: table()
In previous examples, we’ve seen what happens when we put an array or object inside a console.log() or console.dir(). There’s another option for these data types for a more structured display, which is console.table().
Here’s a simple example with an array:
let basicArray = [
  'one',
  'two',
  'three'
];
console.table(basicArray);
table() exampleHere’s the same example in Firefox for comparison.

table() exampleA slight visual difference, but pretty much the same. That said, Chrome does still give you the expandable output under the table, much like you’d see in console.log(). Chrome will also provide basic column sorting if you click on the heading.
The output is similar when passing in an object:
let basicObject = {
  one: 'one',
  two: 'two',
  three: 'three'
};
console.table(basicObject);
table() exampleSo, that was a pretty simple example with basic outputs. How about something a little more complex and is often used in coding projects? Let’s look at an array of objects.
let arrayOfObjects = [
  {
    one: 'one',
    two: 'two',
    three: 'three'
  },
  {
    one: 'one',
    two: 'two',
    three: 'three'
  },
  {
    one: 'one',
    two: 'two',
    three: 'three'
  }
];
console.table(arrayOfObjects);
table() exampleAs you can see, this gets us a nice layout of objects with repeating keys as column labels. Imagine data along the lines of user information, dates, or whatever might be data often used in loops. Keep in mind that all the keys in each of the objects will be represented as a column, whether there is corresponding keys with data in the other objects. If an object doesn’t have data for a key’s column, it appears as empty.
An array of arrays is similar to the array of objects. Instead of keys being labels for the columns, it uses the index of the inner arrays as column labels. So if an array has more items than the other arrays, then there will be blank items in the table for those columns. Just like with the array of objects.
So far, simple arrays and objects have simple output displayed. Even a slightly more complex array of objects still has a solid, useful structure. Things can get a bit different with mixing the data types though.
For example, an array of arrays where one of the inner array items is an object.
let arrayOfArraysWithObject = [
  ['one', 'two', {three: 'three', four: 'four'}],
  ['one', 'two', {three: 'three', four: 'four'}],
  ['one', 'two', {three: 'three', four: 'four'}]
];

console.table(arrayOfArraysWithObject);
table() exampleNow, to see what is contained in those objects in the third column, we’ll have to expand that array output below the table. Not that bad, really. Here’s how Firefox handles the same output.

table() exampleFirefox just lets us expand the object within the table.
How about mixing the data types the other way, where we have an object with arrays as values for each key? It works much the same as the array of arrays. The difference is that each row is labeled with a key instead of the index. Of course, for each level of data type you add to the mix will result in a more complex looking table.
This is all about: time(), timeLog(), and timeEnd()
Here we have a simple way to log how long something takes to complete. We call console.time() with a label, call console.timeLog() with the same label for an update, and call console.timeEnd() again with the same label to stop the timer.
console.time('this is a timer');
console.timeLog('this is a timer');
console.timeEnd('this is a timer');
The output for Chrome and Firefox is much the same. Here’s an example output with code that logs the time every second for five seconds and then stops.

time() example
time() exampleNotice that the reported times are not quite the same, but probably close enough for most requirements. Also, Firefox is nice enough to note that the timer has ended while Chrome requires an assumption once the label stops appearing. The first four lines of output come from the call console.timeLog('this is a timer'); and the last line is from the call to console.timeEnd('this is a timer');.
Dropping breadcrumbs with: trace()
The console.trace() command is actually similar to console.error() and console.warn(). Calling this command will output a stack trace to the console showing the path through the code to that call. We can even pass it a string as a form of label, but other data types such as arrays or objects can be passed. The behavior of passing data like that is the same as what we would get from a console.log() call. It’s a simple way to pass along some information to the console without triggering a more dire looking console.error() or console.warn() call.
debugger
This is a simple command to trigger a pause in the console’s debugger, if it exists. It is similar to placing a breakpoint in the debugger, or the browser’s equivalent, to cause the same type of pause while executing code. Here’s a simple example:
function whatsInHere() {
  debugger;
  // rest of the code
}
In this particular example, the open console’s debugger will pause code execution and the browser will open up the source file to show the line of code as soon as the function is called. It could be useful for easy breakpoints with some complicated projects.
Technically, the debugger command isn’t a part of the console object in the browser. It’s a useful feature that the console will respond to from JavaScript code.
Some additional console utilities
That’s a good look at most of the standard commands available to us in the console object. Each of these will work more-or-less the same across modern browsers. There may be some differences between browsers, as we saw in some of the examples. But there are a few more things I’d like to take a moment to point out, as they might prove useful in various ways.
The following examples can be considered more like console “utilities.” They are not a part of the console object like most of the previous examples. Therefore they are not called with a leading console object reference. These utilities are supported directly by the browsers themselves. They cannot be called from JavaScript code but must be typed directly in the console to be used. In some cases the utility might be unique to a particular browser, in others the utility is supported much the same way in several browsers. Your mileage may vary based on your browser of choice.
$0, $1, $2, $3, $4
These five commands are extremely handy. The first one, $0, represents the currently selected element in the DOM inspector. This essentially provides a shortcut instead of having to use more traditional DOM methods, such as getElementById or a querySelector. You can use it in various ways, within various console commands, or by itself to get information about the currently selected element. For example:
console.log($0);The other commands in this set represent elements that were previously selected. Think of them as a form of selection history. $1 is the previous element, $2 is the previous before that, and so on. Although the first command is available in Firefox, the commands for previously selected elements are not.
$(‘element’), $$(‘elements’)
If you find yourself typing out document.querySelector('element') in the console repeatedly, there’s a shortcut. You can just type $('element') and it performs the same function. The shortcut might remind many of jQuery, but to select multiple elements reminds me of MooTools. To select multiple elements, you’d use $$('elements') instead of document.querySelectorAll('elements').
$x(‘//element’)
This is a shortcut for XPath that will return an array of elements that match the expression. An easy example is $x('//div'), which will present an array of every div element on the page. This isn’t that much different than using $$('div') like we did with $('element'), but there are many options for writing XPath expressions.
One example of a simple step up in a XPath expression is $x('//div[descendant::span]') (thanks to Neil Erdwien for the correction), which would return the div elements on the page that happen to contain a span element. This is the equivalent of :has in CSS Selectors Level 4 draft, which isn’t supported in browsers yet.
These are just basic examples that only scratch the surface of XPath.
clear()
This is another version of console.clear(), but without the “Console was cleared” message.
getEventListeners(object)
This command, when given a DOM element, will report the event listeners registered to that element. For example, using the $0 example from above we can use getEventListeners($0) to get something like this:

etEventListeners() exampleExpanding each item in the array provides various information about that event listener. This function isn’t supported in Firefox, but it does offer something similar that can be found in the DOM inspector.

Clicking on the “event” badge next to the element provides a list of events registered to the element. Then each event can be expanded to show the code involved with the event.
That’s it for now!
I’ll end it here, with a large amount of information detailing various commands that can be used in the browser’s console output or with JavaScript. This isn’t everything that is possible — there’s simply too much to cover. In some cases, each browser has its own capabilities or utilities that can be leveraged. We looked at the bulk of what we might find in Chrome and Firefox, but there’s likely more out there. Plus, there will always be new features introduced in the future. I invite you to dig deeper to discover more ways to leverage browser DevTools for your coding projects.
Really helpful. Awesome!
Well done!
My nit is that $x(‘//div[span]’) returns the div elements on the page that happen to contain a span element as a direct child. To get all divs that contain a span anywhere, you would need $x(‘//div[descendant::span]’). My understanding is that the former is like div:has(> span), and the latter is like div:has(span).
Hey there Neil!
You were indeed correct, I’ve updated the article accordingly. Appreciate the tip.
you mentioned there’s more – where’s a good place to look for that?
The actual console specification is at https://console.spec.whatwg.org/
The MDN docs for console is at https://developer.mozilla.org/en-US/docs/Web/API/console
Google has some info that I referenced during my research at https://developers.google.com/web/tools/chrome-devtools/console/utilities
There a decent of amount of things that I passed on due to article length, especially since most of it at this point is browser specific. I couldn’t really justify including too much browser specific details when the article had already so much material.
I didn’t even touch on the profiling features that’s available.
I hope that helps.
Mashing that bookmark button right now.
Great piece!
I’ve authored a tiny utility, for fun, to output styled console. log commands using an intuitive syntax:
https://github.com/yairEO/console-colors