Slow SQL queries can crush your WordPress site’s performance. Sometimes, slow queries are a result of poorly-formed SQL that never should have been done that way. And sometimes, slow queries were actually fast queries at one point—but as the site grew older, the query got slower and slower, unable to keep up with the expanding database.
Regardless of how your SQL got slow, let’s take a look at a few ways to find and fix problem queries in WordPress.
Finding Slow Queries
Finding the source of slow queries involves 2 steps:
- Identifying which queries are actually the slow ones.
- Finding the code that is generating and executing them.
Let’s look at two plugins and one SaaS that can help us find slow queries.
Query Monitor
Query Monitor is a plugin that provides a ton of information about the current page. In addition to a whole bunch of information about the internal workings of WordPress, it gives a detailed breakdown of:
- How many queries happened on this request
- Which queries on the page took the longest
- Which functions spent the most time on SQL queries
- Whether those queries came from plugins, themes or the WordPress core
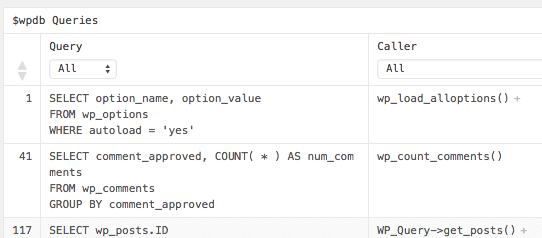
Query monitor even identifies slow queries with scary red text, which makes it super easy to pick out the problem SQL:

Debug Bar
Another excellent tool for finding glacially-slow SQL is the old, trusty Debug Bar plugin. Debug Bar gives you information about the internal workings of WordPress when you load a page with things like:
- WP_Query parameters
- Request information (including rewrite rules matching)
- SQL queries generated by the current page
To enable #3 (SQL tracking) in Debug Bar, make sure to enable SAVEQUERIES somewhere on your site—probably in wp-config.php—like so:
if ( ! defined( 'SAVEQUERIES' ) ) {
  define( 'SAVEQUERIES', true );
}
Warning: SAVEQUERIES has an effect on the performance on your site, and probably shouldn’t be used on a production server. Use it on a development machine instead.
Finding slow SQL isn’t as easy with Debug Bar. For example, it doesn’t provide the sortable tables or highlight slow queries for you. What Debug Bar does provide is a function trace that points you exactly where to find the source of a query.
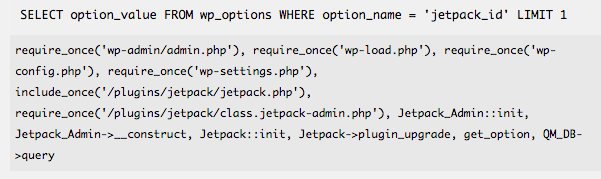
This is a list of the files loaded and the functions that result in the query being executed. Most of the time, you’re interested in the very last entry on the list; this is where the slow query was executed and where you should begin your search. The handy thing about having the context of every single function that leads to this query is that it can shed light on why the SQL was executed in the first place.
NewRelic
NewRelic a service that measures and monitors the performance of your web app, including WordPress. The service provides a metric ton of information about the performance of your site. It’s easy to get lost in the data NewRelic gives you from detailed code execution to line-by-line breakdowns for SQL queries.

There are two major differences between NewRelic and the plugins we mentioned earlier:
- NewRelic gives a lot more detail about the performance of your PHP, down to the number of milliseconds spent in each function
- NewRelic tracks every request to your site in the background, so you can reference it later to find slow SQL. The plugins only give you the current page.
It’s worth noting that NewRelic has a free plan tier that gives general information about the performance of your site, but that you’ll need to upgrade to a paid plan for the bells and whistles for monitoring individual requests and finding slow queries.
Understanding a Slow Query with EXPLAIN
So far, we’ve covered tools for finding slow queries. Now let’s figure out why those queries are bogging things down.
The MySQL EXPLAIN keyword can help, er, explain what’s happening. Adding EXPLAIN to the start of a query shows how MySQL executes a query. For complicated queries, EXPLAIN can help identify slow points in your SQLs, such as slow subqueries or inefficient operations.
For example, if you had a query that looked like this:
SELECT slow_column FROM slow_tableYou could EXPLAIN that query by simply running the following:
EXPLAIN SELECT slow_column FROM slow_tableHere’s what the output of EXPLAIN looks like in phpMyAdmin:

Heck, I admittedly don’t understand all of the internal workings of MySQL, but running EXPLAIN on queries still gives insights into how MySQL is executing my SQL. Is the query using an index? Is it scanning the whole table? Even for simple queries, EXPLAIN provides a smidgen of information to help understand what is going on.
You can run EXPLAIN from the MySQL command line or your favorite MySQL tool.
Fixing Slow Queries
Now that we know our query is slow, and EXPLAIN has given told us why it is, let’s look at a few options for fixing those sluggish issues.
Option 1: Change the Query
On CSS-Tricks, we had a query that was dragging the Edit Post screen to a snail’s pace. The query was part of the Custom Fields meta box. Here’s the SQL:
SELECT meta_key
FROM wp_postmeta
GROUP BY meta_key
HAVING meta_key NOT LIKE '\\_%'
ORDER BY meta_key
LIMIT 100
This particular bit of SQL is fetching a list of meta_keys from the wp_postmeta table that don’t start with an underscore (_). The GROUP BY statement means each result is unique.
Running this query 5 times, here’s how long it takes:
1.7146 sec
1.7912 sec
1.8077 sec
1.7708 sec
1.8456 sec
Could we write a different query to get the same result? We need to select unique meta_keys. Unique is a synonym for distinct, which just so happens to be a SQL statement!
Using the DISTINCT statement, we can do the following:
SELECT DISTINCT meta_key
FROM wp_postmeta
WHERE meta_key NOT LIKE '\\_%'
ORDER BY meta_key
Running our rewritten query a handful of times gives the following results:
0.3764 sec
0.2607 sec
0.2661 sec
0.2751 sec
0.2986 sec
This is hardly a scientific comparison but does reveal a significant improvement!
Option 2: Add an Index
When you run a SQL query on a standard MySQL table, MySQL has to scan the entire table to figure out which rows are relevant to this particular query. When your table gets really big, that scanning starts taking a long time.
That’s where MySQL indexes come in. Indexes take the data in a table and organizes it in a way that makes data much easier to locate. By organizing the data a particular way, indexes help reduce the amount of scanning MySQL does for each query.
Indexes can be added to single columns or across multiple columns. The syntax looks like this:
CREATE INDEX wp_postmeta_csstricks ON wp_postmeta (meta_key)With an index on meta_key, the original SQL query time looks like this:
0.0042 sec
0.0024 sec
0.0031 sec
0.0026 sec
0.0020 sec
That’s really snappy!
INSERT creates a row or UPDATE is used on an indexed table, the index is re-calculated, which can be a costly operation. Indexes make reading from the table faster, but writing to the table is slower. A well-placed index can make your queries fly, but don’t go index-crazy without monitoring the overall effects of the index on your database.Option 3: Cache the Query Results
We know we have a slow query. Instead of changing the query, what if we just stored the results of the query? That way, we’d limit how often the query was performed, and we’d get a “free pass” most of the time.
To cache the query, we could use the WordPress Transients API. Transients are used for storing results of expensive operations, such as:
- Requests to external websites (e.g. fetching recent Facebook posts)
- Slow chunks of processing (e.g. searching big strings with a regular expression)
- Slow database queries!
Storing a query result with transients looks something like this:
if ( false === ( $results = get_transient( 'transient_key_name' ) ) ) {
  $results = ...; // Do the slow query to get the results here
  // 60 * 60 is the expiration in seconds - in this case, 3600 seconds (1 hour)
  set_transient( 'transient_key_name', $results, 60 * 60 );
}
Storing query results in a transient like so means the query will only be performed once every hour or so. That leads us to the BIG TRANSIENT WARNING: Be careful using transients for things that change a lot.
If you have a query with results that won’t change often, using transients is a nifty way to avoid hitting the database so frequently.
Picking an Approach
We’ve outlined three options, and there are probably 17 other ways to solve this slow query. Which approach do we take?
When working on code that isn’t my own, I prefer to follow the programmer’s maxim: “Do the simplest thing that can possibly work.”
Option 1 (rewriting the query) yielded excellent results, but what if the rewritten query doesn’t always have the same results? We could unknowingly bork our code with a slightly-off query.
Option 2 (adding an index) isn’t always possible depending on the table and columns used by the query. In the case of WordPress core tables, you’d need to worry about side-effects of indexes:
- Does the core updating routine expect extra indexes?
- Will adding an index slow down other queries, like
INSERTandUPDATE?
Option 3 (caching the results via transients) has minimal impact—we’re not changing the original query and we don’t need to modify the database structure.
Most of the time I use Option 3. In your particular case, you might choose another option depending on the query you’re fixing or the particular site having SQL problems. There isn’t a one-size-fits-all answer to most performance problems, so you’re free to disagree with my choice—or, try all three at once!
Stay Tuned
We outlined a real problem here. The Custom Fields box on CSS-Tricks really was a culprit for some very slow database queries. We also outlined different paths toward potential solutions, but we didn’t actually give you a real coded solution. We’ll be doing a second post that covers that soon, and hopefully gives you the tools for fixing your own slow queries after you’ve discovered them.
Great article! Thanks.
Awesome! Thanks for the share!
When transients are stored in the database (versus something like APC, Xcache, or Redis), expired entries are only removed when they are requested. If your keys contain some degree of uniqueness (like a user id or something) and aren’t called frequently, there can be a lot of bloat sitting around the database.
I’ve also used a file-based fragment caching of database queries to speed things up on a site with a lot of expensive queries. You can use wp_cache_set() and wp_cache_get() with your persistent caching tool of choice. Similar to transients, but you can keep them in a file or in memory which should be faster. You can customize the fragments with user IDs if they’re specific to a particular user, like a list of favorite or unread posts, for example.
I had a site which was taking 3-5 seconds for some pages with complex queries and got it down to 0.4 – 0.6 seconds per page. Pretty huge improvement in the experience for visitors!
Thats my secret all my queries are slow
Nice article, learned a few things.
What about using views and stored procedures as a way to improve performance of queries.
The real problem is that wordpress can’t access the mysql slow query logs, if it could then it could share common slow queries, to suggest rewrites of wordpress core.
Great and in-depth article with wonderful instruction.
Note that MySQL has a built-in feature for slow query logging:
https://dev.mysql.com/doc/refman/5.1/en/slow-query-log.html
Possibly some of the tools mentioned in the article use this, but it can be done without any additional tooling, just saying.
You could wrap a delete_transient() function in the ‘save_post’ hook to prevent caching queries when new data is available.
Hey Andy,
Thanks for the tips. Using NewRelic was not helping us as it should to resolve our problems, and the person from support who was dealing with our website somproduct.ro was more or less invisible. After 12 days we decided to not use their service anymore. Our experience was really bad but we will definitely need to find other ways to prevent the high loading time and to monitor our website.
Myles McNamara wrote in with a specific query problem that made a big difference for him:
I found one method that made a HUGE increase in load time (~14 seconds down to ~2 seconds or less), was due to the meta_key index in post_meta table not being used, reference here:
https://core.trac.wordpress.org/ticket/33885
All this was fixed by simply running this MySQL command:
Tom Nowell from Automattic writes in: