The idea for this article sparked when Chris wrote this in Thank You (2018 Edition):
I almost wish our URLs had years in them because I still don’t have a way to scope analytic data to only show me data from content published this year. I can see the most popular stuff from the year, but that’s regardless of when it was published, and that’s dominated by the big guides we’ve had for years and keep updated.
I have been a long-time reader of CSS-Tricks, but have not yet had something to contribute with. Until now. Being a Google Analytics specialist by day, this was at last something I could contribute to CSS-Tricks. Let’s extend Google Analytics on CSS-Tricks!
Enter Google Analytics custom dimensions
Google Analytics gives you a lot of interesting insights about what visitors are doing on a website, just by adding the basic Google Analytics snippet to every page.
But Google Analytics is a one-size-fits-all tool.
In order to make it truly meaningful for a specific website like CSS-Tricks we can add additional meta information to our Google Analytics data.
The year an article was posted is an example of such meta data that Google Analytics does not have out of the box, but it’s something that is easily added to make the data much more useful. That’s where custom dimensions come in.
Create the custom dimension in Google Analytics
The first thing to do is create a new custom dimension. In the Google Analytics UI, click the gear icon, click Custom Definitions and then click Custom Dimensions.

This shows a list of any existing custom dimensions. Click the red button to create a new custom dimension.

Let’s give the custom dimension a descriptive name. In this case, “year” seems quite appropriate since that’s what we want to measure.

The scope is important because it defines how the metadata should be applied to the existing data. In this case, the article year is related to each article the user is viewing, so we need to set it to the “hit” scope.

Another example would be metadata about the entire session like if the user is logged in, that would be saved in a session-scoped custom dimension.
Alright, let’s save our dimension.
When the custom dimension is created, Google Analytics provides examples of how to implement it using JavaScript. We’re allowed up to 20 custom dimensions and each custom dimension is identified by an index. In this case, “year” is the first custom dimension, so it was created in Index 1 (see dimension1 in the JavaScript code below).

If we had other custom dimensions defined, then those would live in another index. There is no way to change the index of a custom dimension, so take note of the one being used. A list of all indices can always be found in the overview:

That’s it, now it’s time to code!
Now we have to extract the article year in the code and add it to the payload so that it is sent to Google Analytics with the page view hit.
This is the code we need to execute, per the snippet we were provided when creating the custom dimension:
var dimensionValue = 'SOME_DIMENSION_VALUE';
ga('set', 'dimension1', dimensionValue);
Here is the tricky part. The ga() function is created when the Google Analytics snippet is loaded. In order to minimize the performance hit, it is placed at the bottom of the page on CSS-Tricks. This is what the basic Google Analytics snippet looks like:
<script>
(function(i,s,o,g,r,a,m){i['GoogleAnalyticsObject']=r;i[r]=i[r]||function(){
(i[r].q=i[r].q||[]).push(arguments)},i[r].l=1*new Date();a=s.createElement(o),
m=s.getElementsByTagName(o)[0];a.async=1;a.src=g;m.parentNode.insertBefore(a,m)
})(window,document,'script','//www.google-analytics.com/analytics.js','ga');
ga('create', 'UA-12345-1', 'auto');
ga('send', 'pageview');
</script>
We need to set the custom dimension value after the snippet is parsed and before the page view hit is sent to Google Analytics. Hence, we need to set it here:
// ...
ga('create', 'UA-12345-1', 'auto');
ga('set', 'dimension1', dimensionValue); // Set the custom dimension value
ga('send', 'pageview');
This code is usually placed outside a WordPress Loop, but that’s where we would have access to meta information like the article year. Because of this, we need to store the article year in a JavaScript variable inside the loop, then reference that variable in the Google Analytics snippet when we get to the bottom of the page.
Save the article year within the loop
In WordPress, a standard loop starts here:
<?php if ( have_posts() ) : while ( have_posts() ) : the_post(); ?>…and ends here:
<?php endwhile; else : ?>
	<p><?php esc_html_e( 'Sorry, no posts matched your criteria.' ); ?></p>
<?php endif; ?>
Somewhere between those lines, we extract the year and save it in a JavaScript variable:
<script>
	var articleYear = "<?php the_time('Y') ?>";
</script>
Reference the article year in the Google Analytics snippet
The Google Analytics snippets is placed on all pages of the website, but the year does not make sense for all pages (e.g. the homepage). Being the good JavaScript developers that we are, we will check if the variable has been defined in order to avoid any errors.
ga('create', 'UA-68528-29', 'auto');
if (typeof articleYear !== "undefined") {
		ga('set', 'dimension1', articleYear);
}
ga('send', 'pageview');
That’s it! The Google Analytics page view hit will now include the article year for all pages where it is defined.
Custom dimensions do not apply to historical data
One thing to know about custom dimension — or any other modifications to your Google Analytics data — is that they only apply to new data being collected from the website. The custom dimensions described in this article was implemented in January 2019, and that means if we look at data from 2018 it will not have any data for the custom dimensions.
This is important to keep in mind for the rest of this article when we begin to look into the data. The custom dimensions are added to all posts on CSS-Tricks, going all the way back to 2007, but we are only looking at page views that happened in 2019 — after the custom dimensions was implemented. For example, when we look at articles from 2011, we are not looking at page views in 2011 — we are looking at page views of posts from 2011 in 2019. This is important to keep in mind when we start to look at posts from previous years.
All set? OK, let’s take a look at the new data!
Viewing the data in Google Analytics
The easiest way to see the new data is to go to Behavior → Site Content → All Pages, which will show the most viewed pages:

In the dropdown above the table, select “year” as a secondary dimension.

That gives us a table like the one below, showing the year for all articles. Notice how the homepage, which is the second most viewed page, is removed from the table because it does not have a year associated with it.
We start to get a better understanding of the website. The most viewed page (by far) is the complete guide to Flexbox which was published back in 2013. Talk about evergreen content!

Secondary is good, primary is better
OK, so the above table adds some understanding of the most viewed pages, but let’s flip the dimensions so that year is the primary dimension. There is no standard report for viewing custom dimensions as the primary dimension, so we need to create a custom report.

Give the Custom Report a good name. Finding the metrics (blue) and dimensions (green) is easiest by searching.

Here is what the final Custom Report should look like, with some useful metrics and dimensions. Notice how we have selected Page below Year. This will become useful in a second.

Once we hit Save, we see the aggregate numbers for all article years. 2013 is still on top, but we now see that 2011 also had some great content, which was not in the top 10 lists we previously looked at. This suggests that no single article from 2011 stood out, but in total, 2011 had some great articles that still receive a lot of views in 2019.
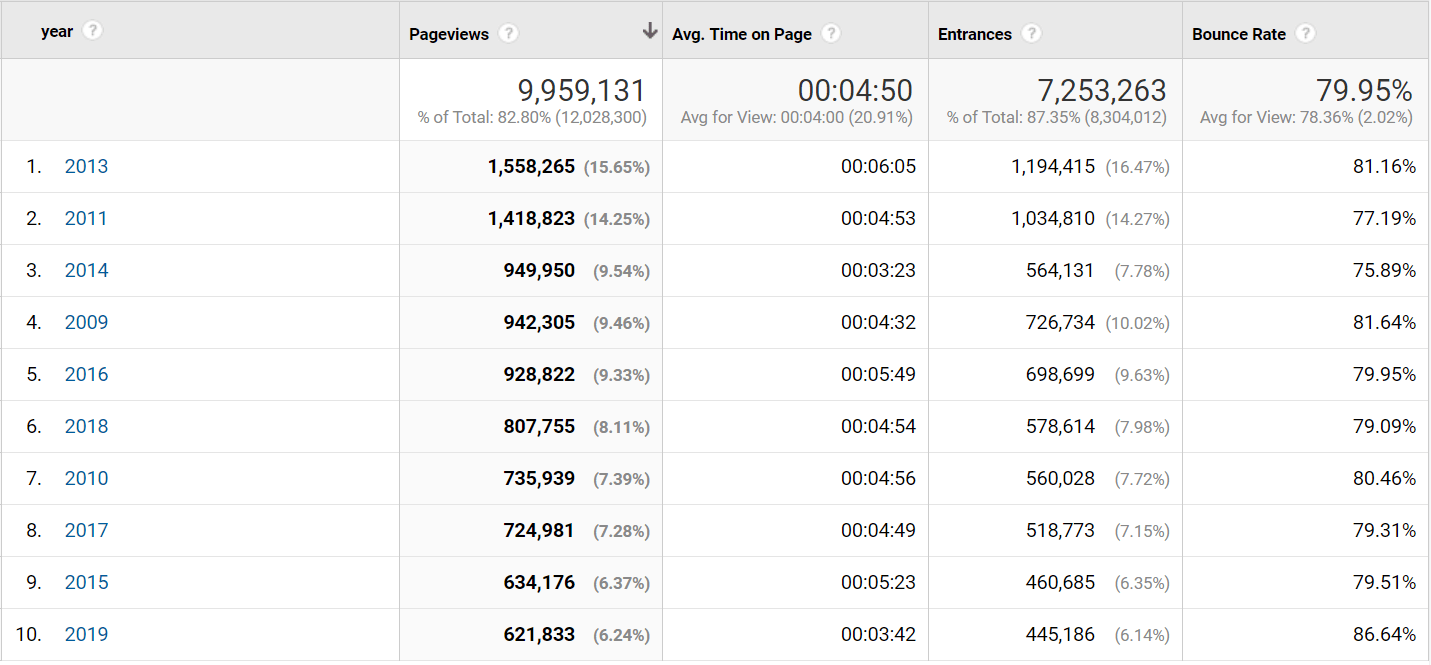
The percentage next to the number of page views is the percentage of the total page views. Notice how 2018 “only” accounts for 8.11% of all page views and 2019 accounts for 6.24%. This is not surprising but shows that CSS-Tricks is partly a huge success because of the vast amount of strong reference material posted over the years, which users keep referring to.
Let’s look into 2011.
Remember how we set up the Custom Report with the Page below the Year in dimensions? This means we can now click 2011 and drill-down into that year.

It looks like a lot of almanac pages were published in 2011, which in aggregate has a lot of page views. Notice the lower-right corner where it says “1-10 of 375.” This means that 375 articles from 2011 have been viewed on the site in 2019. That is impressive!
Back to the question: Great content from 2018
Before I forget: Let’s answer that initial question from Chris.
Let’s scope the analytics data to content published this year (2018). Here are the top 10 posts:

Understanding the two-headed beast
In Thank You (2018 Edition), Chris also wrote:
For the last few years, I’ve been trying to think of CSS-Tricks as this two-headed beast. One head is that we’re trying to produce long-lasting referential content. We want to be a site that you come to or land on to find answers to front-end questions. The other head is that we want to be able to be read like a magazine. Subscribe, pop by once a week, snag the RSS feed… whatever you like, we hope CSS-Tricks is interesting to read as a hobbyist magazine or industry rag.
Let’s dig into that with another custom dimension: Post type. CSS-Tricks uses a number of custom post types like videos, almanac entries, and snippets in addition to the built-in post types, like posts or pages.
Let’s also extract that, like we did with the article year:
<script>
	var articleYear = "<?php the_time('Y') ?>";
	var articleType = "<?php get_post_type($post->ID) ?>";
</script>
We’ll save it into custom dimension Index 2, which is hit-scoped just like we did with year. Now we can build a new custom report like this:

Now we know that blog posts account for 55% of page views, while snippets and almanac (the long-lasting referential content) account for 44%.
Now, blog posts can also be referential content, so it is safe to say that at least half of the traffic on CSS-Tricks is coming because of the referential content.
From a one-man band to a 333-author content team
When CSS-Tricks started in 2007 it was just Chris. At the time of writing, 333 authors have contributed.

Let’s see how those authors have contributed to the page views on CSS-Tricks using — you probably guessed it — another custom dimension!
<script>
	var articleYear = "<?php the_time('Y') ?>";
	var articleAuthor = "<?php get_the_author_meta('ID') ?>";
	var articleType = "<?php get_post_type($post->ID) ?>";
</script>
Here are the author IDs for the top 10 most viewed authors in 2019.

Let’s break this down even further by year with a secondary dimension and select 500 rows in the lower-right corner, so we get all 465 rows.

We can then export the data to Excel and make a pivot table of the data, counting authors per year.

You like charts? We can make one with some beautiful v17 colors, showing the number of authors per year.

It is amazing to see the steady growth in authors contributing to CSS-Tricks per year. And given 2019 already has 33 different authors, it looks like 2019 could set a new record.
But are those new authors generating any page views?
We know Chris’ author ID is 2. Let’s make a new pivot chart where we compare Chris to all other authors.

…and then chart that over time.

It definitely looks like CSS-Tricks is becoming a multi-author site. While Chris is still the #1 author, it is good to see that the constant flow of new high-quality content does not solely depend on him, which is a good trend for CSS-Tricks and makes it possible to cover a lot more topics going forward.
But what happened in 2011, you might ask? Let’s have a look. In a custom report, you can have five levels of dimensions. For now we will stick with four.

Now we can click on the year 2011 and get the list of authors.

Hello author #25! That is Sara Cope, by the way. What awesome content did you write in 2011?

Looks like a lot of those almanac pages we saw earlier. Click that!

Indeed, a lot of almanac pages! 107 to be exact. A lot of great content that still receives lots of page views in 2019 to boot.
A word about PII data
You may have noticed that we are using the ID of the author instead of the actual name. There is a good reason for that.
Full names is considered PII (Personally Identifiable Information) by Google and it is against Google Analytics Terms of Service to track such PII data in Google Analytics.
This means that even though it would be convenient to have the names directly accessible in the Google Analytics reports we cannot send the full names to Google Analytics. We need to track the ID instead as an anonymous identifier.
The ID is meaningless to Google (or any other third party) and they will not be able to link it to a specific person. Only we can do that. And that is the correct way to use third-party tracking services like Google Analytics.
Summary
Google Analytics is a powerful tool to understand what users are doing on your website, and with a little work, meta data that is specific to your website can make it extra powerful. As seen in this article, adding a few simple meta data that’s already accessible in WordPress can unlock a world of opportunities to analyze and add a whole new dimension of knowledge about the content and visitors of a site, like we did here on CSS-Tricks.
If you’re interested in another similar journey involving custom dimensions and making Google Analytics data way more useful, check out Chris Coyier and Philip Walton in Learning to Use Google Analytics More Effectively at CodePen.
I’m always adding such custom stuff to my GA stats to make more sense of the data by using goals, dimensions, and conversions tracking. But this content/dimension drill down view is something I have never tried. Thank you for sharing, pretty freakin’ awesome for a multi-author blog.
@Ahmad: You’re welcome! Custom reports are a powerful way to drill down into the data because it lets you combine both standard and custom dimensions to add a lot more context to the metrics you are looking at.
This was a super helpful article. Thank you for writing it! I would love to see a post on querying popular urls via api, to include auth and custom dimensions. I always feel like I’m wandering around in the wilderness when I work with the GA api.
Thanks a lot for the kind words! A great way to start working with the GA reporting API to pull data is using the Google Analytics add-on for Google Sheets, where you can learn the “API names” of all the core dimensions and metrics and create some useful API requests: https://developers.google.com/analytics/solutions/google-analytics-spreadsheet-add-on
Very cool, learned how to do something in Google analytics i didn’t know was possible while also learning some trivia about css tricks itself.
I am very happy to hear that both the insights into CSS-Tricks and Google Analytics was interesting! I definitely learned a lot about what has made CSS-Tricks the success that it is by writing this article.
Great write up – thanks Jacob, this was a really interesting read and I learned something new :D
A question I have around analytics – what are you doing/what can be done in relation to the ever growing, privacy focused browser market (such as Brave w/5.5m+ active monthly users) where by default, analytics scripts are blocked – there’s a potential to miss out on a fairly significant chunk of key analytic information there, especially if we’re relying on users “disabling” the privacy feature on a given site
Hi Will. Thanks a lot for the kind words, I am very happy it was interesting to read!
Personally I think the increasing awareness of privacy is a good thing, so users are aware how they are being tracked. For every user there is a trade-off between privacy and relevancy.
I prefer relevancy of ads and personalized content, so I don’t mind websites tracking me, to build a profile of me. The more, the better. And that also includes “selling my data” to advertisers, which means they will only show me relevant ads. I like that trade-off.
But if a user prefer privacy, I think we as website owners should respect that.
But I am hoping that GDPR and the increased focus on privacy will also make more people aware of the trade-off it has on relevancy.
I’m still really digging into and enjoying this article, but your instructions seem to conflict with this doc:
https://developers.google.com/analytics/devguides/collection/gtagjs/custom-dims-mets
Where you have
ga('set', 'dimension1', dimensionValue); // Set the custom dimension valueThey have
https://developers.google.com/analytics/devguides/collection/gtagjs/custom-dims-mets#send-custom-dimensions
Any comment on that?
Hi Scott
The syntax is a little different depending on the version of the Google Analytics library.
CSS-Tricks uses the Universal Analytics version, which is often referred to as analytics.js and that uses this syntax: https://developers.google.com/analytics/devguides/collection/analyticsjs/custom-dims-mets
The current library is the Global Site Tag (gtag.js) which is the one you are linking to.
In your Google Analytics snippet, you can see if it references analytics.js or gtag.js and use the corresponding syntax.
Hope that helps?