There is a natural connection between Data Visualization (dataviz) and SVG. SVG is a graphics format based on geometry and geometry is exactly what is needed to visually display data in compelling and accurate ways.
SVG has got the “visualization” part, but SVG is more declarative than programmatic. To write code that digests data and turns it into SVG visualizations, that’s well suited for JavaScript. Typically, that means D3.js (“Data-Driven Documents”), which is great at pairing data and SVG.
You know what else is good at dealing with data? React.
The data that powers dataviz is commonly JSON, and “state” in React is JSON. Feed that JSON data to React component as state, and it will have access to all of it as it renders, and notably, will re-render when that state changes.
React + D3 + SVG = Pretty good for dataviz
I think that idea has been in the water the last few years. Fraser Xu was talking about it a few years ago:
I like using React because everything I use is a component, that can be any component writen by myself in the project or 3rd party by awesome people on NPM. When we want to use it, just
importorrequireit, and then pass in the data, and we get the visualization result.
That components thing is a big deal. I’ve recently come across some really good libraries smooshing React + D3 together, in the form of components. So instead of you leveraging these libraries, but essentially still hand-rolling the actual dataviz components together, they provide a bunch of components that are ready to be fed data and rendered.
nivo

nivo provides a rich set of dataviz components, built on top of the awesome d3 and Reactjs libraries.
Victory

Victory is a set of modular charting components for React and React Native. Victory makes it easy to get started without sacrificing flexibility. Create one of a kind data visualizations with fully customizable styles and behaviors. Victory uses the same API for web and React Native applications for easy cross-platform charting.
react-vis

[react-vis is] a composable charting library
Recharts
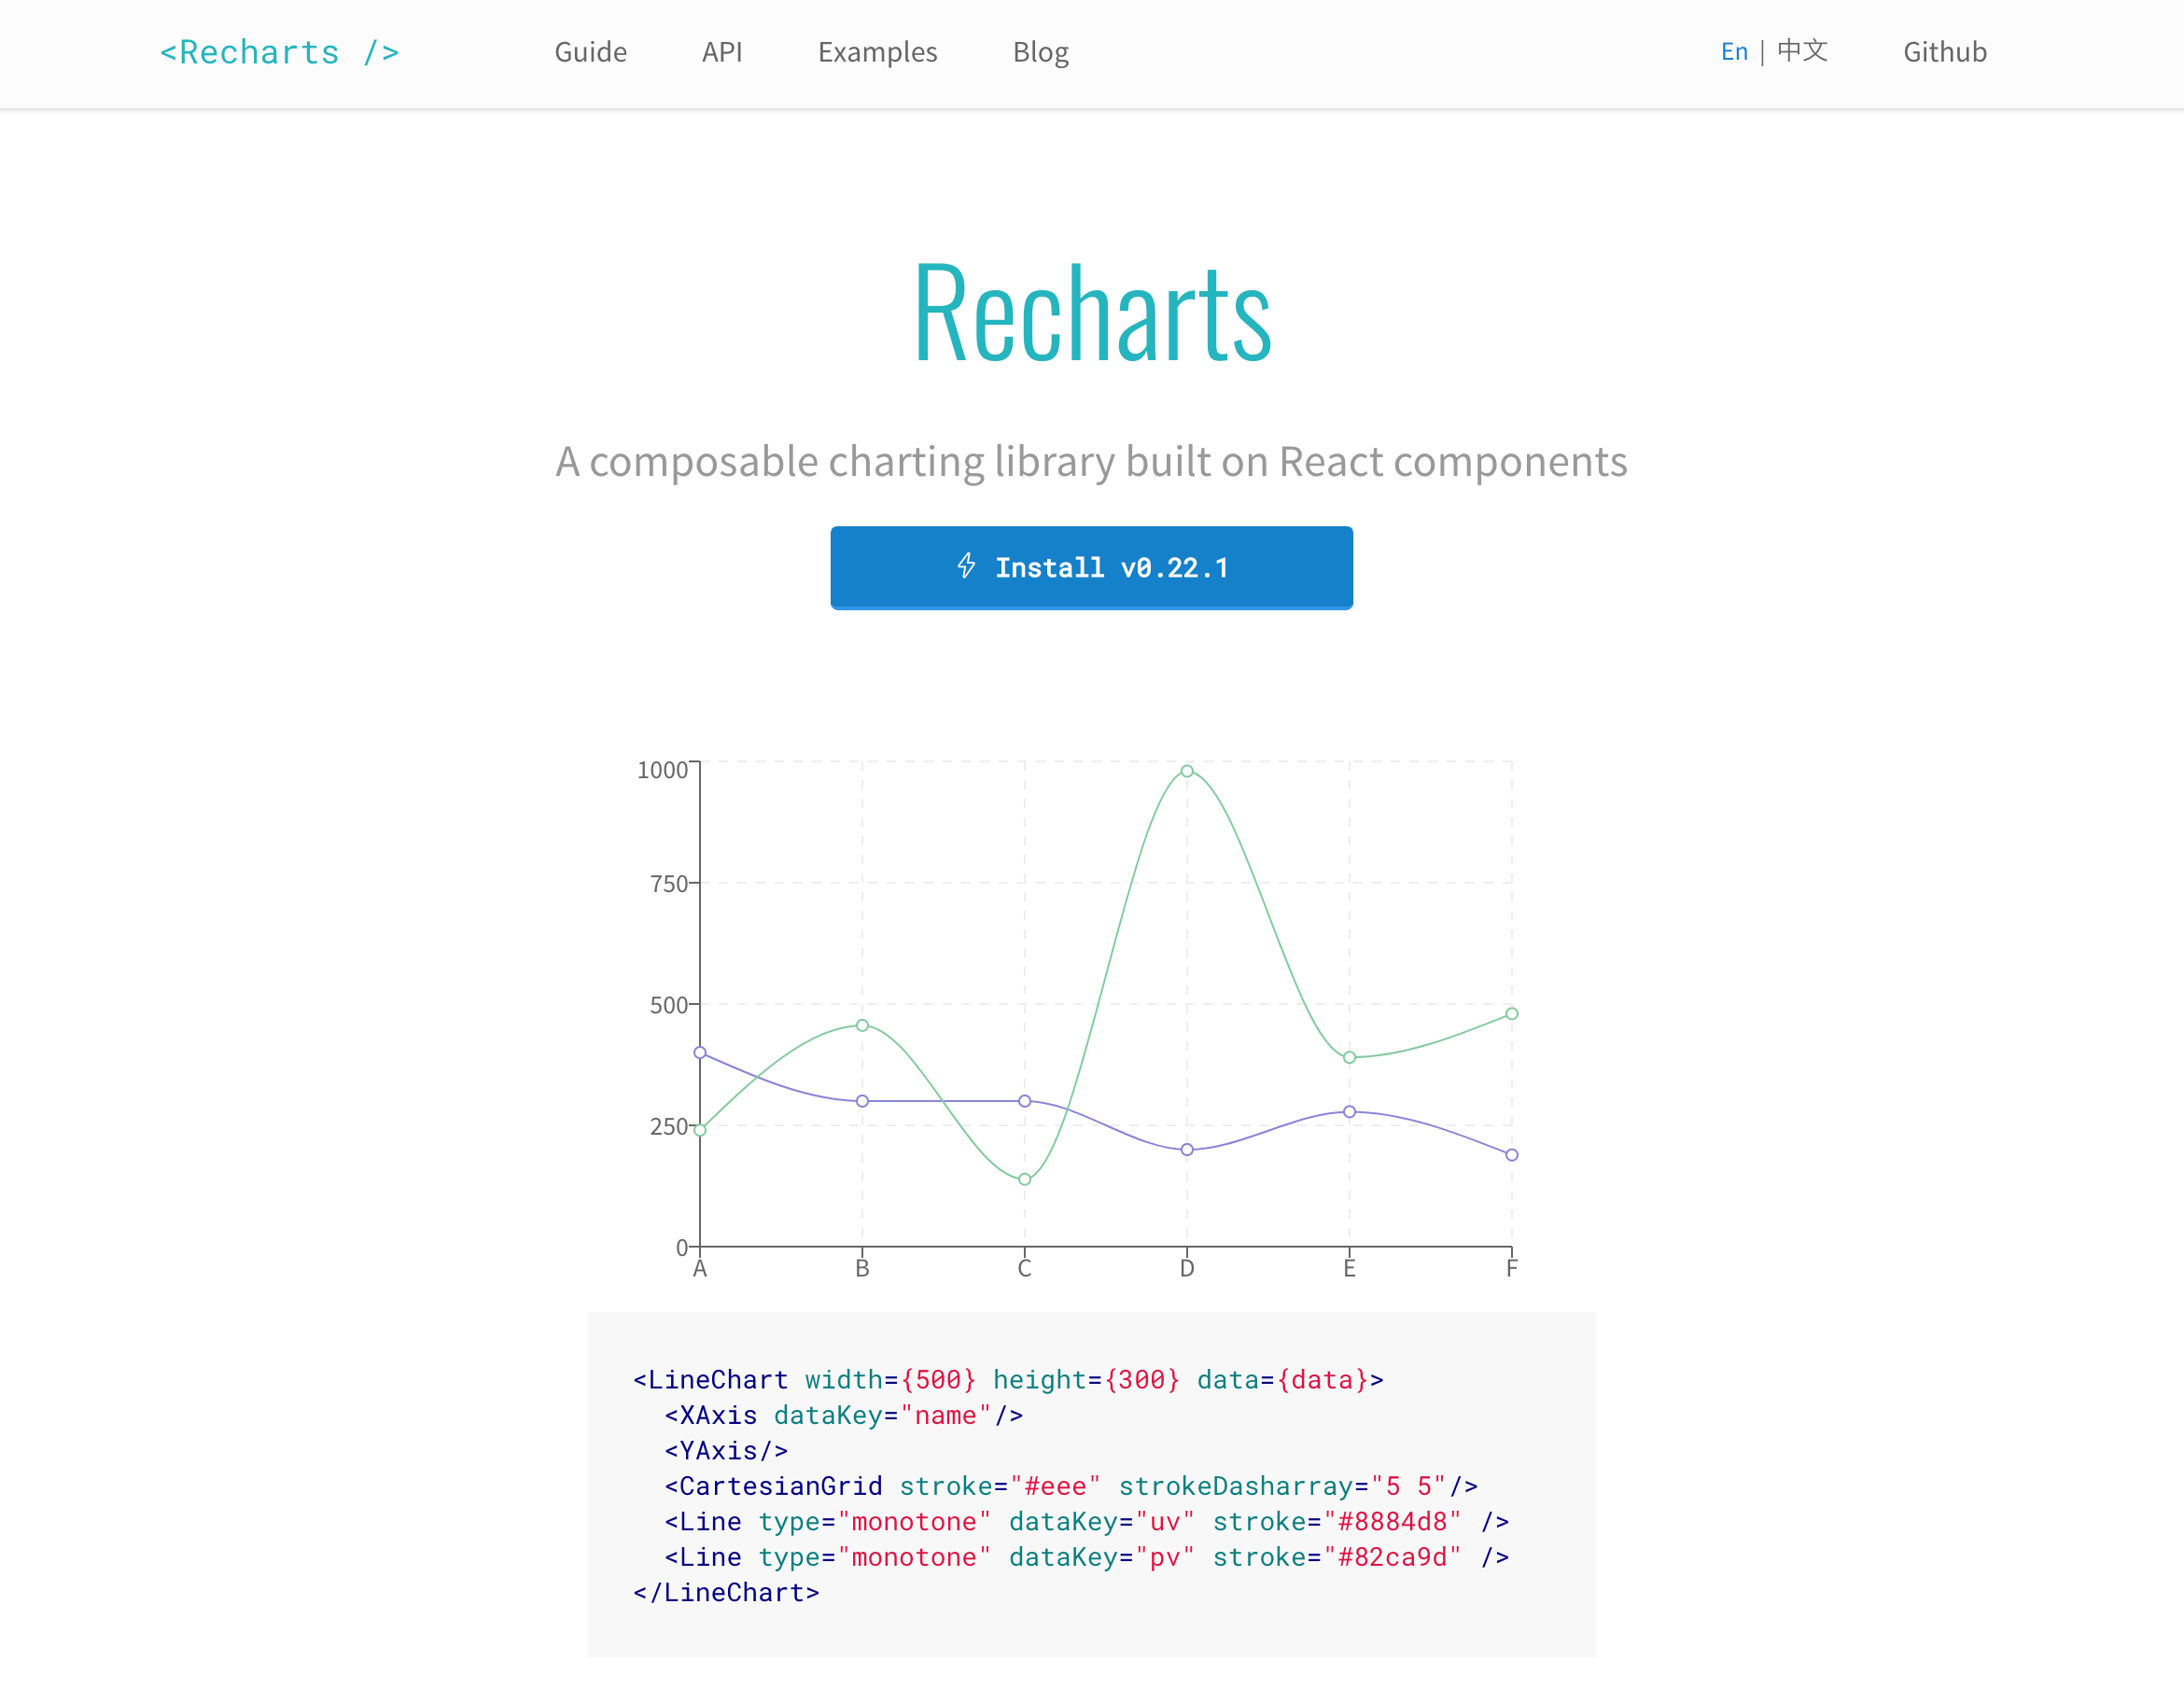
A composable charting library built on React components
React D3
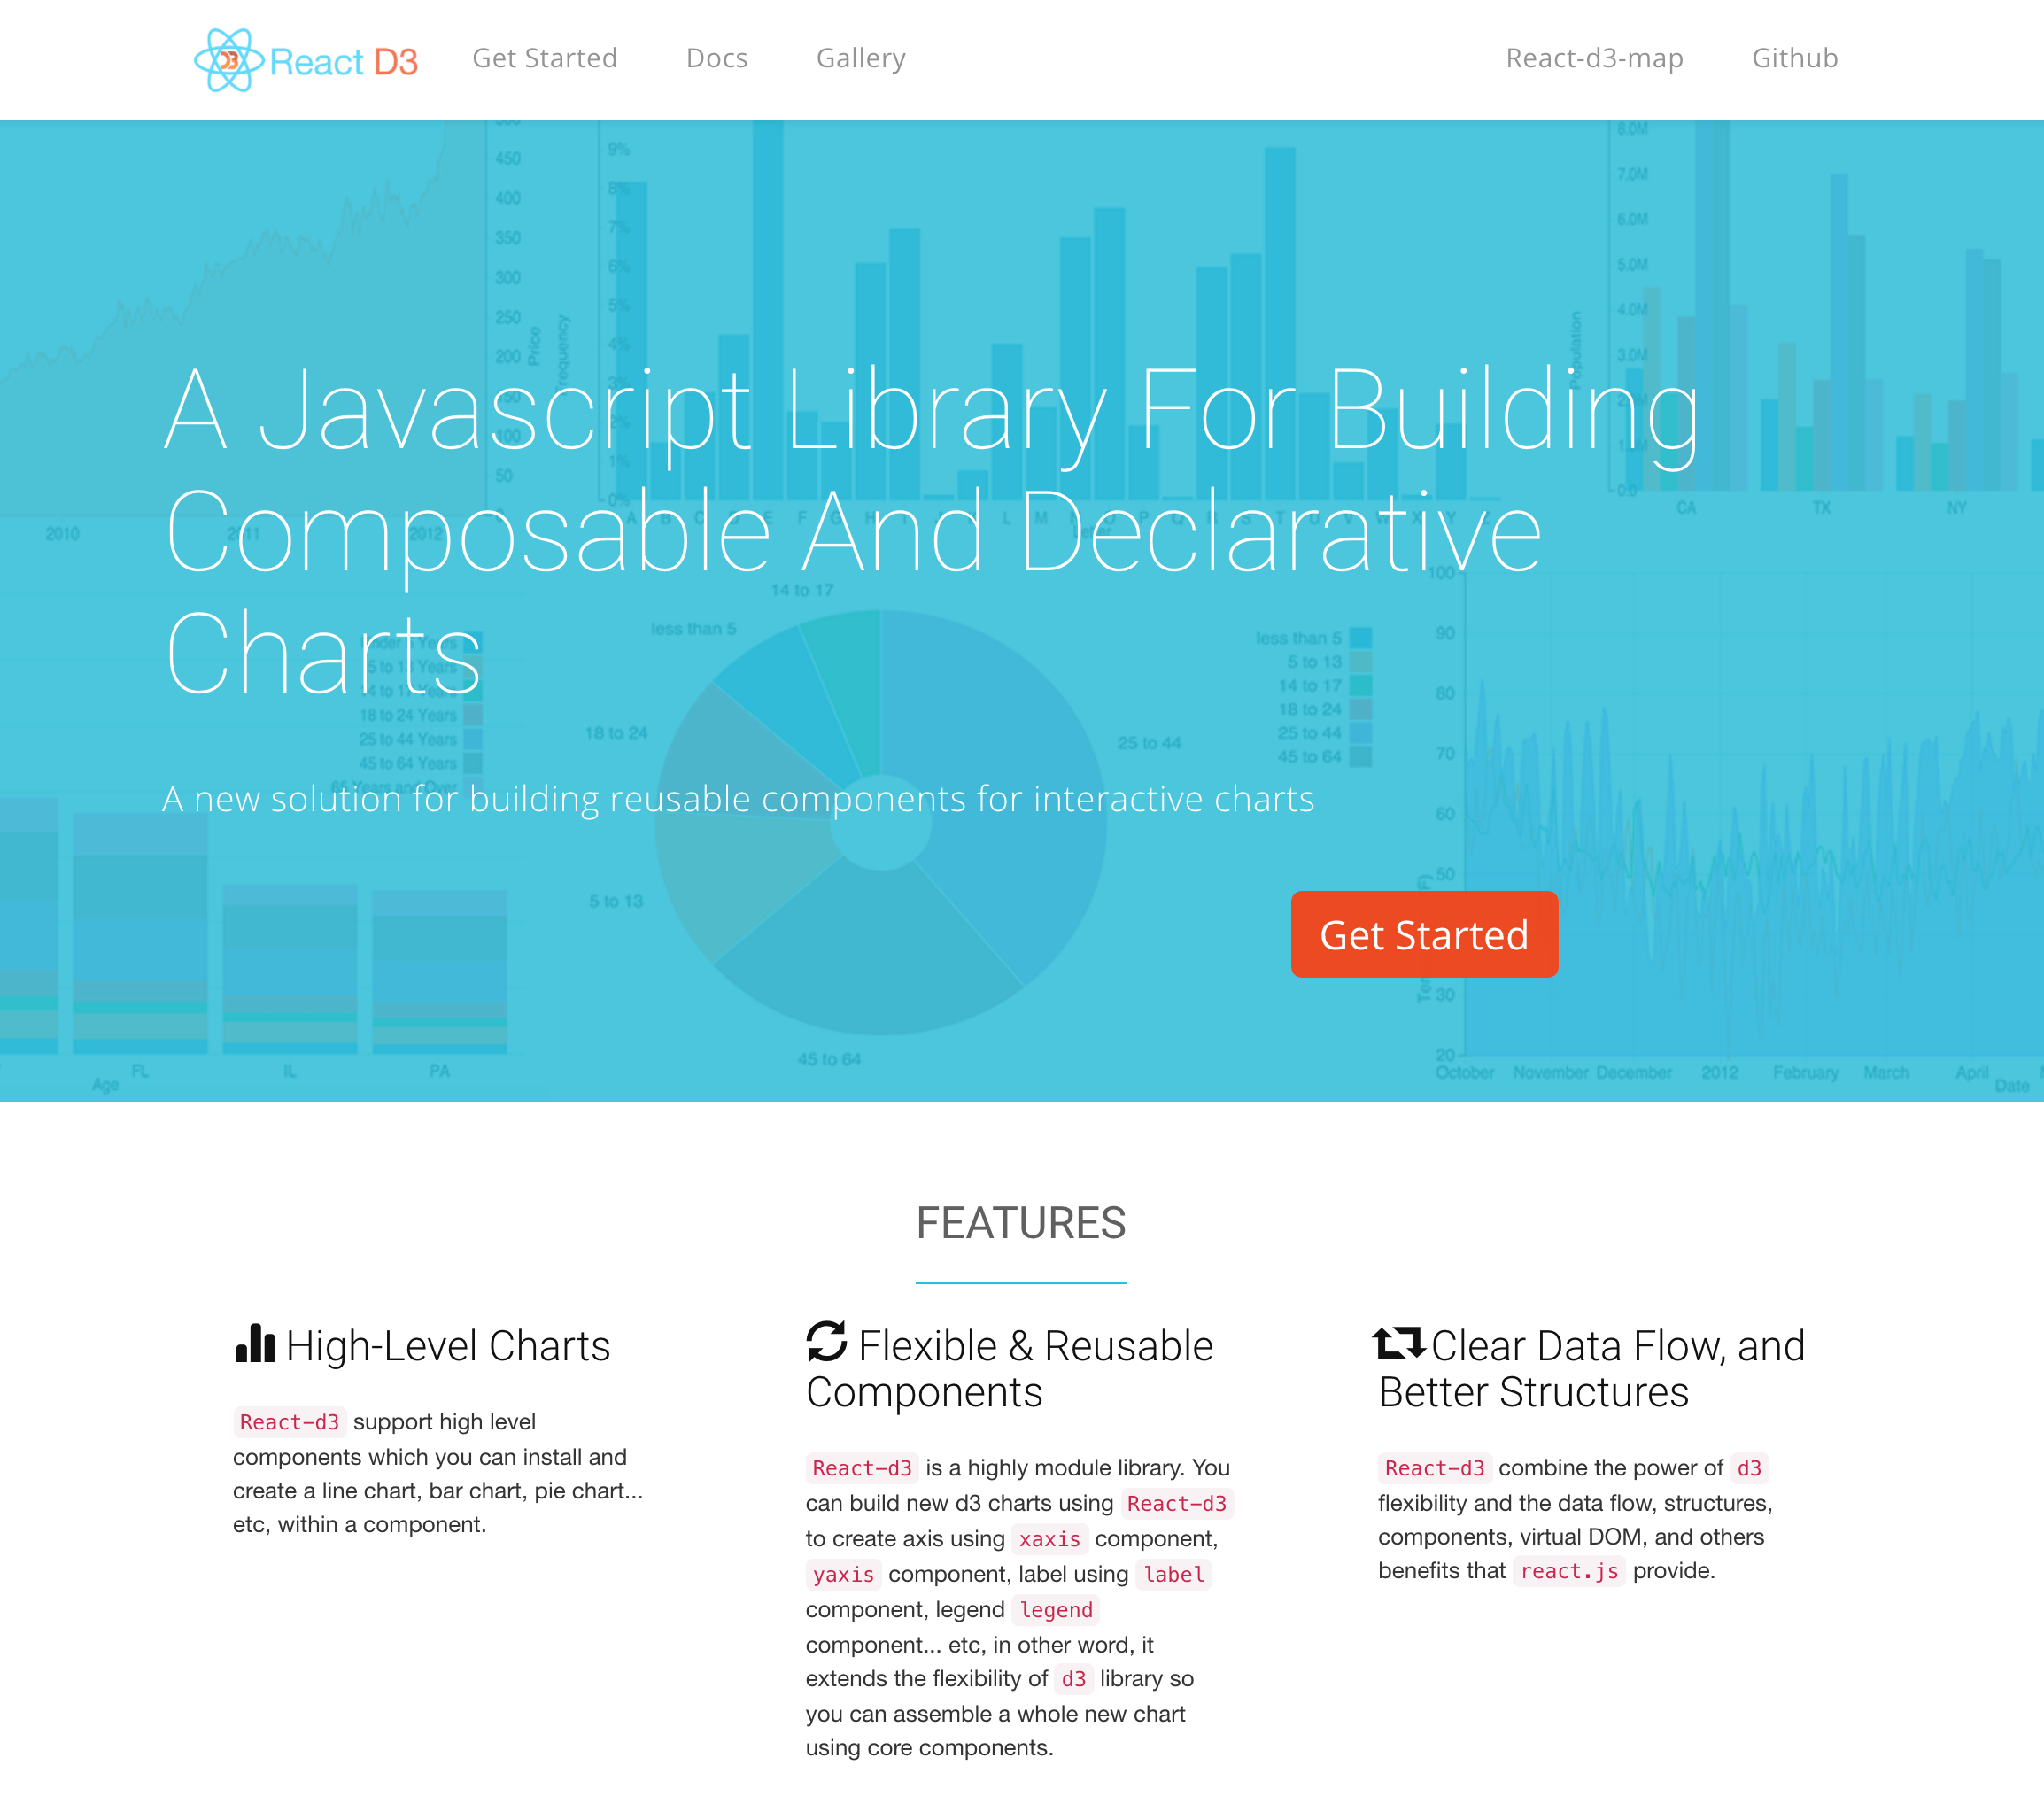
A Javascript Library For Building Composable And Declarative Charts. A new solution for building reusable components for interactive charts.

Don’t forget Semiotic.
Yes!
https://emeeks.github.io/semiotic/#/semiotic/
Great post! I would definitely have a play around React + D3 + SVG. I’m doing a lot more Angular than React but I think this will change soon.
Thank you!
Missing the most customizable and low-level of them all, vx
https://github.com/hshoff/vx
CxJS offers a nice set of charting components based on React and SVG. You can see it here in action.
https://docs.cxjs.io/charts/line-graphs